
|
Life Data Folio Analysis Settings |
||

The Weibull++ life data folio control panel allows you to configure the analysis settings for the data sheet and view/access the results. It consists of multiple pages, each containing options for performing particular tasks. This topic focuses on the Main page of the Weibull++ life data folio control panel, which contains most of the tools you will need to perform life data analysis. For more information about the control panel in general, see Control Panels.
The Distribution drop-down list allows you to select a life distribution to model the failure behavior of the data. There are nine distributions and three special analysis methods to choose from.
The nine distributions are: Weibull, exponential, lognormal, normal, generalized gamma, gamma, logistic, loglogistic and Gumbel. The ReliaWiki resource portal has information on the statistical characteristics of each distribution at: http://www.reliawiki.org/index.php/Life_Distributions.
Tip: If you are not certain which distribution would provide the best fit for your data, you can use the Distribution Wizard to guide you through the selection process.
The special analysis methods are:
Mixed Weibull analysis is used for analyzing data sets that reflect different trends in the failure behavior. This method may be useful when dealing with failure modes that cannot be assumed to be independent (i.e., the occurrence of one failure mode affects the probability of occurrence of the other mode) and/or when it is not possible to identify the failure mode responsible for each individual data point. To use mixed Weibull analysis, you will need to specify how many subpopulations exist in the data set (2, 3 or 4). The software will determine the proportion of units that fall under each subpopulation, and then calculate the Weibull parameters of those subpopulations. The overall reliability of the full data set is then computed by obtaining the sum of the proportional reliability contributions of each subpopulation.
Bayesian-Weibull analysis is based on the concepts of Bayesian statistics. It is typically used in situations when you have a small sample size and a strong prior knowledge of what the failure behavior is likely to be.
Competing Failure Modes (CFM) analysis is used for analyzing data sets that contain failures due to different types of failure modes. The occurrence of one failure mode results in a failure for the product; hence, the failure modes are said to “compete” to cause the failure. This analysis can be used when the failure modes are assumed to be statistically independent (i.e., the occurrence of one failure mode does not affect the probability of occurrence of the other mode) and the failure mode responsible for each failure can be clearly identified. To use CFM analysis, you will need to categorize the times in the data set according to failure modes and then choose one type of life distribution to model the failure behavior of each mode separately. The overall reliability is computed by obtaining the reliability due to each failure mode and then multiplying together the reliability values.
The Analysis Settings area provides a summary of the settings that will be used to fit the distribution. Click the options displayed in blue text to toggle between the available options.
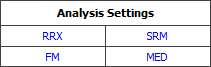
The following table serves as a guide to the abbreviations. These settings are also available on the Analysis page of the control panel (see Life Data Folio Analysis Settings for a description of these settings). Note that the available options will vary depending on the data type, distribution and analysis method you have selected.
Analysis Method |
Rank Method |
Rank Regression on X (RRX) |
Standard Ranking Method (SRM) |
Rank Regression Y (RRY) |
ReliaSoft Regression Method (RRM) |
Non-Linear Rank Regression (NLRR) |
|
Maximum Likelihood Estimation (MLE) |
|
Confidence Bounds Method |
Rank Method |
Fisher Matrix Confidence Bounds (FM) |
Median Ranks (MED) |
Likelihood Ratio Confidence Bounds (LRB) |
Kaplan-Meier Estimator (K-M) |
Bayesian Confidence Bounds (BSN) |
|
Beta-Binomial Confidence Bounds (BB) |
|
The Analysis Summary area displays the calculated parameters and other results that may be used to evaluate how well the chosen distribution or analysis method fits the data set. As an example, the following picture shows the analysis results for a particular data set.
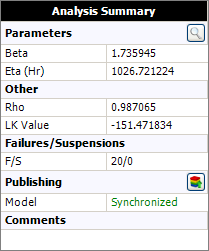
Depending on your application settings, additional information may also be displayed:
The Rho value (correlation coefficient) is automatically calculated and displayed in the results if the parameters were estimated using rank regression. Rho is a measure of how well the regression line falls onto a straight line on a probability plot. The closer the value of rho is to +/-1, the better the linear fit. A value of zero would indicate that the data points are randomly scattered and have no pattern or correlation to the regression line model.
The LK Value (likelihood function value) compares how well different models fit the same data set. The model with the highest LK value is considered to have the best fit statistically for that data. However, because this value is influenced by the sample size and the variability of the data set, it varies across different data sets and cannot be used by itself to evaluate a particular model.
The Pnz (percent non-zero) is automatically calculated and displayed in the results if the data set contains failures at t = 0. Pnz represents the proportion of the population with non-zero failure times. A value of 1 indicates that there are no zero failure times in the data set (which is the most common scenario in life data analysis); a decimal value indicates that the data set includes zero failure times (such as out-of-the-box failures, for example). The model parameters are calculated based on non-zero failure times, and the PNZ value is used as a multiplier when calculating certain metrics (e.g., reliability, unreliability) based on the model.
The number of failures and suspensions. This includes failures at t = 0 but excludes suspensions at t = 0.
The model status (as shown in the previous picture) is displayed if the result of the analysis is associated with a published model. The status "Synchronized" indicates that the published model reflects the latest results from the analysis. If the analysis has been modified since the model was last published (e.g., if more data has been added, an analysis setting has changed, etc.), the status will display as "Out of Sync." (See Publishing Models.)
Tip: If you use the 3-parameter Weibull distribution, you have the option to display the theta parameter, which is the sum of the values of the eta and gamma parameters. To include the theta parameter in the results, select the Show Theta check box on the Weibull++ Folios page of the Application Setup. Note that for the 1-parameter and 2-parameter Weibull distributions, the value of gamma is zero; therefore, if you select to display theta for these distributions, the value of theta will be identical to the value of eta. As an alternative, you can select to always display the theta parameter instead of eta. To do this, click the Calculations page of the Application Setup and select the Use Theta parameter scheme on Weibull check box.
The following tools may also be used in conjunction with your own engineering knowledge about the model in order to further evaluate the fit of the distribution to the data set.
For a rank regression analysis, the Probability Plot shows you how well the solution line tracks the plotted data points. This allows you to visually assess the fit of a distribution. This method can be used only when the parameters have been calculated using rank regression.
Confidence Bounds allow you to quantify the amount of uncertainty in the parameter estimates and in the reliability predictions due to sampling error. The narrower the confidence bounds, the closer the estimates are to the true value of the parameters and the better the precision on the reliability predictions. You can visualize the confidence bounds by using plots or obtain point calculations on the confidence bounds by using the Quick Calculation Pad.
The Goodness of Fit Results utility uses three different tests to determine how well the parameters of the distribution fit the data. Note that it can only be used to evaluate data sets that do not contain censored data.
The folio tools are arranged on the left side of the Main page of the control panel. Use these tools to manage data and experiment with the results of your analysis.
![]() Calculate estimates
the parameters of the chosen distribution, based on the current data set
and the specified analysis settings. This tool is also available by choosing
Life Data > Analysis > Calculate.
Calculate estimates
the parameters of the chosen distribution, based on the current data set
and the specified analysis settings. This tool is also available by choosing
Life Data > Analysis > Calculate.
![]() Plot
creates a new sheet in the folio that provides a choice of applicable
plot types. For life data folios, this includes plots such as reliability
vs. time, failure rate vs. time, probability plot, etc. This tool is also
available by choosing Life Data >
Analysis > Plot.
Plot
creates a new sheet in the folio that provides a choice of applicable
plot types. For life data folios, this includes plots such as reliability
vs. time, failure rate vs. time, probability plot, etc. This tool is also
available by choosing Life Data >
Analysis > Plot.
![]() QCP
opens the Weibull++
Quick Calculation Pad, which allows you to calculate results based
on the analyzed data sheet, such as the probability of failure, mean life,
etc. This tool is also available by choosing Life
Data > Analysis > Quick Calculation Pad.
QCP
opens the Weibull++
Quick Calculation Pad, which allows you to calculate results based
on the analyzed data sheet, such as the probability of failure, mean life,
etc. This tool is also available by choosing Life
Data > Analysis > Quick Calculation Pad.
![]() Distribution Wizard
opens the Distribution Wizard,
which helps you select the distribution that best fits your data based
on the selected parameter estimation method (i.e., RRX, RRY or MLE). This
tool is also available by choosing Life
Data > Analysis > Distribution Wizard.
Distribution Wizard
opens the Distribution Wizard,
which helps you select the distribution that best fits your data based
on the selected parameter estimation method (i.e., RRX, RRY or MLE). This
tool is also available by choosing Life
Data > Analysis > Distribution Wizard.
![]() Alter Data Type opens
the Weibull++ Folio Data Sheet
Setup window, which allows you to change the data entry columns in
the current data sheet. Note that when you change the setup, you may lose
information already entered in the data sheet. For example, switching
the data sheet from one that supports interval data to one that supports
only right censored data will remove all the inspection times. This tool
is also available by choosing Life Data
> Format and View > Alter Data Type.
Alter Data Type opens
the Weibull++ Folio Data Sheet
Setup window, which allows you to change the data entry columns in
the current data sheet. Note that when you change the setup, you may lose
information already entered in the data sheet. For example, switching
the data sheet from one that supports interval data to one that supports
only right censored data will remove all the inspection times. This tool
is also available by choosing Life Data
> Format and View > Alter Data Type.
![]() Change Units opens
the Change Units window, which allows you
to change the units for the values in the current data sheet.
Change Units opens
the Change Units window, which allows you
to change the units for the values in the current data sheet.
![]() Auto Group Data opens
the Auto Group Data window, which allows
you to group together identical data points. Grouping data significantly
speeds up calculations when you have a very large data set. This tool
is also available by choosing Life Data
> Options > Auto Group Data.
Auto Group Data opens
the Auto Group Data window, which allows
you to group together identical data points. Grouping data significantly
speeds up calculations when you have a very large data set. This tool
is also available by choosing Life Data
> Options > Auto Group Data.
![]() Alter Parameters (also
called Alter Parameters w/o Recalculation) allows you to manually alter
the value of one (or more) parameters, while keeping the original values
of the rest of the parameters and the variance/covariance matrix the same.
The LK value, the solution line on plots and all subsequent analyses will
be based on the modified set of parameters.
Alter Parameters (also
called Alter Parameters w/o Recalculation) allows you to manually alter
the value of one (or more) parameters, while keeping the original values
of the rest of the parameters and the variance/covariance matrix the same.
The LK value, the solution line on plots and all subsequent analyses will
be based on the modified set of parameters.
![]() Specify Points opens
the Specify Points window, which allows
you to adjust the way that the line is fitted to the points for a rank
regression analysis. The ranks will be calculated based on all of the
data points but the regression line will be fitted only to the points
you have specified. This tool is also available by choosing Life
Data > Options > Specify Points.
Specify Points opens
the Specify Points window, which allows
you to adjust the way that the line is fitted to the points for a rank
regression analysis. The ranks will be calculated based on all of the
data points but the regression line will be fitted only to the points
you have specified. This tool is also available by choosing Life
Data > Options > Specify Points.
![]() Color Data Values
applies different font colors to the entries in the data sheet for easy
visualization. Note that whenever you edit or add new data to the data
sheet, you must choose one of the Color Data Values commands again in
order to apply the font colors.
Color Data Values
applies different font colors to the entries in the data sheet for easy
visualization. Note that whenever you edit or add new data to the data
sheet, you must choose one of the Color Data Values commands again in
order to apply the font colors.
Default Color applies a black font color to all the entries in the data sheet.
Based on Data Type applies different font colors based on the type of censoring: red for failure data (no censoring), green for suspension data, magenta for left-censored data and blue for interval data.
Based on Subset ID 1 applies different font colors based on unique subset IDs in the Subset ID 1 column. If a data point has no entry in the Subset ID 1 column, then the font color is black.
Based on Subset ID 2 applies different font colors based on unique subset IDs in the Subset ID 2 column. If a data point has no entry in the Subset ID 2 column, then the font color is black.
Based on Subset ID Combination applies font colors based on unique combinations of subset IDs in the Subset ID 1 and Subset ID 2 columns. If a data point has no subset IDs, the font color is black, but if a data point has at least one subset ID, then it is treated as having a unique combination of subset IDs.
![]() Batch Auto Run opens
the Batch Auto Run window, which allows
you to extract data from an existing data set based on the subset ID.
This tool is also available by choosing Life
Data > Options > Batch Auto Run.
Batch Auto Run opens
the Batch Auto Run window, which allows
you to extract data from an existing data set based on the subset ID.
This tool is also available by choosing Life
Data > Options > Batch Auto Run.
© 1992-2019. HBM Prenscia Inc. ALL RIGHTS RESERVED.
| E-mail Link |