
|
|
||

Mixed Weibull analysis (also call multimodal Weibull) is a method that can be used in situations when dealing with failure modes that cannot be assumed to be independent (i.e., the occurrence of one failure mode affects the probability of occurrence of the other mode) and/or when it is not possible to identify the failure mode responsible for each individual data point.
To use mixed Weibull analysis, you will need to specify how many subpopulations exist in the data set (2, 3 or 4). The software will then determine the proportion of units that fall under each subpopulation and calculate the Weibull parameters of those subpopulations. The overall reliability of the full data set is then calculated by taking the sum of the proportional reliability contributions of each subpopulation.
The ReliaWiki resource portal provides more information about the mixed Weibull distribution at http://www.reliawiki.org/index.php/The_Mixed_Weibull_Distribution.
Tip: If the failure modes are assumed to be statistically independent and the data set can be directly categorized into distinct subpopulations, competing failure modes (CFM) analysis may be more appropriate.
Data sets with mixed populations are often recognized by the "dogleg" or S-shaped curve pattern of the data points on a probability plot. For example, consider the following data set.
5.2 |
140.1 |
11.3 |
150.5 |
16.6 |
166.0 |
35.9 |
186.7 |
38.2 |
188.8 |
55.7 |
191.3 |
71.8 |
198.8 |
72 |
206.7 |
116.4 |
234.3 |
135.8 |
249.8 |
When the data set is analyzed with a 2-parameter Weibull distribution and plotted on a probability plot, as shown next, the pattern of the data points looks as if it could be modeled by two straight lines of different slopes. This indicates the possible existence of subpopulations in the data set.
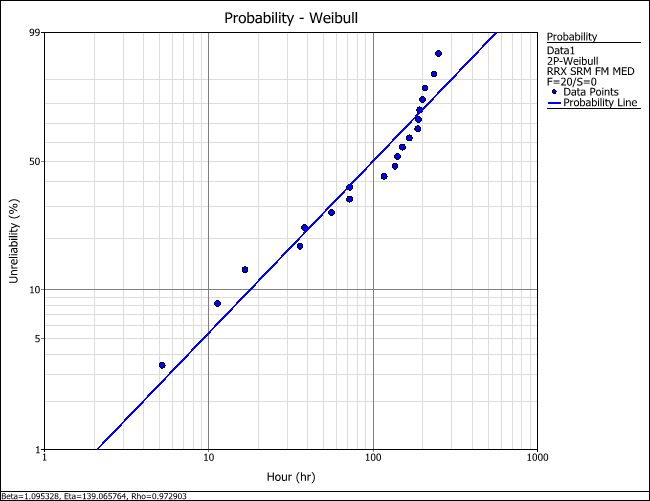
Based on the pattern observed on the probability plot, let us assume that there are two subpopulations in the data set. To use the mixed Weibull distribution, follow the steps below:
Enter the data from the table into a Weibull++ life data folio.
On the Main page of the control panel, click the Distribution drop-down list. Choose Mixed Weibull and then choose the number of subpopulations to consider (for this example, choose 2 Subpop-Mixed Weibull). Click Calculate.
Weibull++ will automatically fit a 2 subpopulation mixture model with Weibull parameters and portion values. In the results shown next, Beta[1] and Eta[1] are the parameters that were calculated for the first subpopulation. The result showing Portion[1] = 0.6245 means that subpopulation 1 comprises 62.45% of the data points.
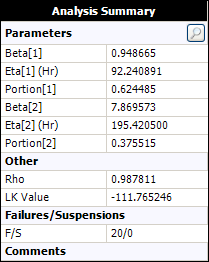
Note: The subpopulation numbers are ordered based on the value of the scale parameter (eta). The order is used only to identify the subpopulation and does not affect the analysis.
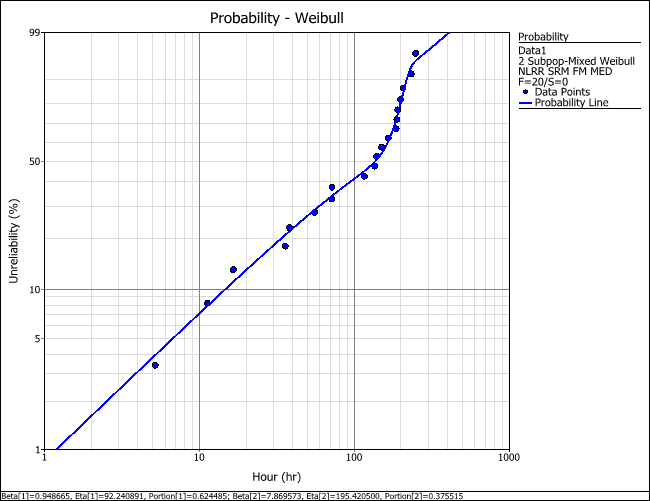
To view the probability plot of the data set, click the Plot icon on the control panel. The plot shows that the 2-subpopulation mixed Weibull distribution provides a better fit to the pattern of the data points compared to the 2P- Weibull distribution. You can use the Quick Calculation Pad (QCP) to make reliability predictions within the range of the observations; however, care must be taken when making projections outside the range of the observed failure times (i.e., extrapolation).
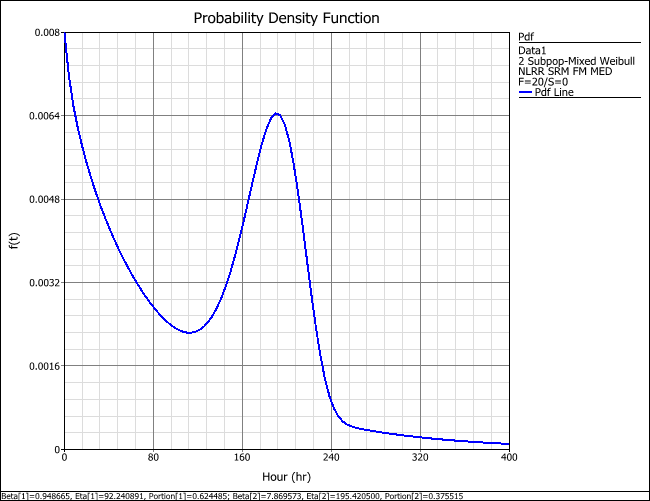
To visualize the mixed Weibull distribution, choose Pdf Plot in the Plot Type drop-down list. The plot shows that from time = 0 to approximately time = 100, the pdf exhibits the “decreasing with time” trend characteristic of a Weibull distribution with a beta value less than or equal to 1. This region characterizes the contribution of subpopulation 1. From time = 100 onward, the pdf exhibits the bell-shaped curve typical of a Weibull distribution with a beta value in the vicinity of 5. This region characterizes the contribution of subpopulation 2.
Note that the mixed Weibull analysis method does not specify which data point belongs to which subpopulation. If reliability predictions are needed at the subpopulation level, you will need to gather additional information in order to identify which data point belongs to which subpopulation.
© 1992-2019. HBM Prenscia Inc. ALL RIGHTS RESERVED.
| E-mail Link |