
Many of the analysis folios, diagram sheets and other interfaces in ReliaSoft desktop applications utilize a control panel that allows you to make required inputs, initiate the desired analysis or simulation and view/access applicable results. This topic describes some features that are common to most control panels. (For XFMEA, RCM++, RBI, MPC and Lambda Predict, see System Panel and Analysis panel instead.)
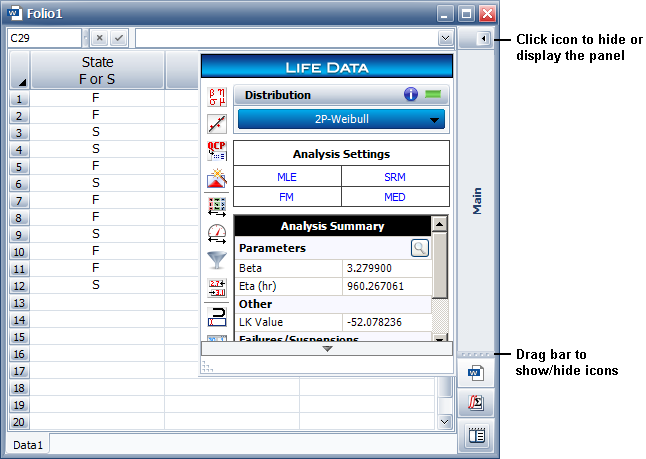
Many control panels and navigation panels contain multiple pages that vary depending on the type of analysis. You can switch between pages by clicking either the large buttons or the small icons at the bottom of the panel.
If you drag the horizontal splitter bar to the bottom of the control panel, all of the pages will be accessed by small icons. If you drag it as far up as it will go, all of the pages will be accessed by large buttons.
![]()
The control panel can be toggled between hidden and displayed states by clicking the Hide or Show icon in its title bar.
When the control panel is hidden, only the title bar and page icons will be visible on the right side of the window (as shown next using a Weibull++ folio as an example). When you click the bar, the active page will be displayed temporarily. When you click anywhere outside of the control panel page, it will be automatically hidden again.
The Identifiers page of the control panel allows you to enter identifying details (e.g., category, name, part number, etc.) that will be associated with the analysis and any models or SEP summaries that are published from the analysis. This will help you to find, filter and group analyses and resources throughout the repository.
In folios that can have multiple data sheets, the Folio Identifiers are edited via the Item Properties window, and the Data Sheet Identifiers can be entered directly in the control panel. Use an asterisk (*) if you want the data sheet’s identifiers to be the same as the folio's (see Identifiers).
The Publishing page allows you to view and manage information from the current analysis that is shared throughout the Synthesis Platform.
Model/Fitted Model – publishes a model based on the current analysis. See Publishing Models.
SEP Summary – publishes a summary of the current analysis to the SEP web portal. This is visible only if the enterprise database is configured for SEP and you have the "Publish to SEP web portal" permission. See Publishing to SEP.
Metrics – shows all of the metric resources that are associated with the current analysis. See Showing Metrics in Folios/Diagrams.
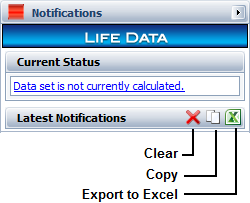
When applicable, the Notifications page provides information on the Current Status of the analysis, along with any warnings or errors. A green light indicates that the folio has been analyzed, and a red light indicates that the folio has not been analyzed since changes were last made. The Latest Notifications area displays any warnings and errors generated during analysis.
In BlockSim only, the Utilized Resources page displays a grouped list of all of the resources that are used directly by blocks in the diagram (i.e., not applied via any other resource or tool).
For example, a URD that is assigned to a block will be displayed in this list, but the model assigned to the URD will not be shown, nor will any tasks assigned to the URD. Similarly, if a block belongs to a maintenance group, that maintenance group will be shown in the list. However, if a block has a state change trigger, the maintenance group(s) used for that trigger will not be shown unless some block in the diagram belongs to them.
This list is not updated automatically; if you have made changes to the diagram, click the Refresh icon to update the list.
![]()
Double-click a resource in the list to open its properties window for viewing or editing. Click the Resource Manager icon to view/manage all of the resources available in the project.
![]()
© 1992-2019. HBM Prenscia Inc. ALL RIGHTS RESERVED.
| E-mail Link |