Home > Weibull++ Life Data Folios > Special Analysis Methods > Competing Failure Modes (CFM) Analysis
|
|
||

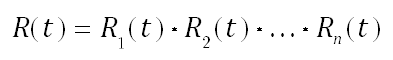
Often, a product could fail due to any of several possible causes of failure. For a non-repairable component, each unit can only fail once; hence, if the occurrence of any one failure mode results in a failure of the component, then the failure modes are said to “compete” to cause the failure. This can be viewed as a series reliability model, where the overall reliability is equal to the product of the reliability equations for all of the failure modes, or:
|
(1) |
where n is the number of failure modes considered. Note that competing failure modes (CFM) analysis can be performed only when the product is non-repairable and when it can be assumed that the failure modes are statistically independent (i.e., the occurrence of one failure mode does not affect the probability of occurrence for the other failure modes). Furthermore, the Competing Failure Modes option that is built-in to the Weibull++ life data folio supports the analysis of up to four competing failure modes and applies the same distribution to analyze all of the modes. If your analysis does not fit these conditions, it may be more appropriate to use a reliability block diagram (RBD) analysis approach.
The ReliaWiki resource portal provides more information about competing failure modes analysis at: http://www.reliawiki.org/index.php/Competing_Failure_Modes_Analysis.
Tip: When it is not possible to categorize your data set into distinct modes, mixed Weibull analysis may be more appropriate.
Consider a water pump that is considered failed when either its gasket or its valve fails. To use CFM analysis in a Weibull++ life data folio, you must categorize each failure time into distinct subset IDs. The following data sheet shows the categorized failure times.
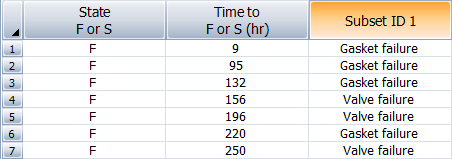
Note: The subset ID can be any text up to 30 characters, including spaces. For example, "A _ _ X" is not the same as "A _ X" where " _ " is used to designate a space.
On the Main page of the control panel, choose Competing Failure Modes and then choose a distribution that is appropriate to analyze the data for each failure mode (for this example, choose CFM-Weibull). Next, select MLE as the parameter estimation method and click Calculate. You will be presented with a list of all the subset IDs in your data sheet, as in the figure shown next. If you have more than one subset ID column in your data sheet, a drop-down list will be available to allow you to choose which column to use in the analysis.
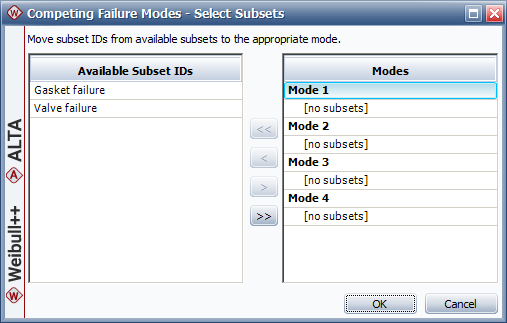
You can define up to four modes to include in the CFM analysis, and each mode can be associated with one or more subset IDs [1]. First, select the subset ID(s) in the Available Subsets column. Then select a mode from the Modes column and click the arrow buttons to assign the selected subset ID(s) to the selected mode. You can also double-click or drag a subset ID to assign it to a mode.
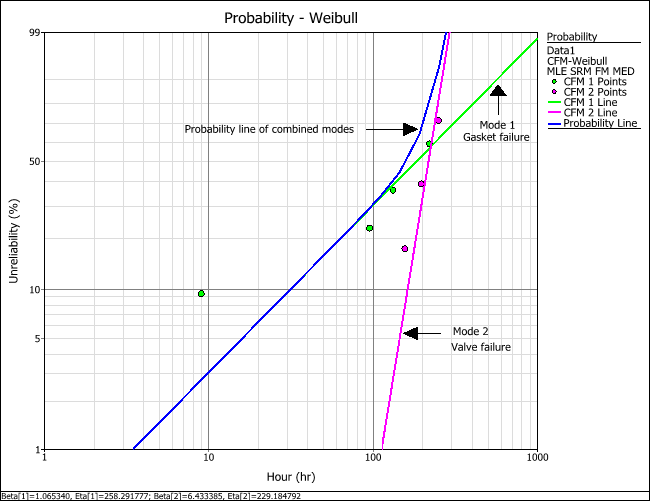
Assign "Gasket failure" to "Mode 1" and "Valve failure" to "Mode 2," and then click OK. Weibull++ will automatically calculate the parameters for each mode separately.
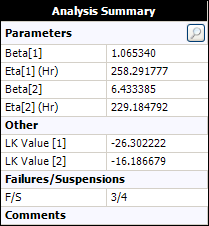
To visualize how each failure mode contributes to the water pump’s overall probability of failure, click the Plot icon on the control panel. The solution of the probability line is based on Eqn. (1). All other plots and the calculations you perform via the Quick Calculation Pad (QCP) are also based on the same equation.
As mentioned above, the competing failure modes (CFM) analysis options that are built into the Weibull++ life data folio (e.g., CFM-Weibull, CFM-lognormal, etc.) assume a simple series reliability model and use only one type of distribution to analyze all the modes. When your analysis is more complicated, Weibull++ offers a different method for failure modes analysis. The method described next applies in any or all of the following circumstances:
The analysis involves more than four failure modes.
The failure modes are described by different life distributions.
The relationship between the failure modes does not follow a series configuration. For example, if more than one failure mode must occur together in order for the component to fail, a parallel configuration must be used for the analysis and this is referred to as "complex failure modes analysis" rather than "competing failure modes analysis."
Using the same water pump system in the previous example, we'll create an RBD that illustrates the relationship between the failure modes.
The first step is to analyze separately the data due to each mode. When you analyze the data set of a particular mode, the failure times for all other competing modes are considered to be suspensions. This captures the fact that those units operated for a period of time without experiencing the failure mode of interest before they were removed from observation when they failed due to another mode. You can easily perform this step via the Batch Auto Run utility. To do this, follow the steps below:
In the data sheet that contains the failure times for the gasket and valve, open the Batch Auto Run utility by choosing Life Data > Options > Batch Auto Run or by clicking the icon on the Main page of the control panel.
![]()
In the Batch Auto Run window, click the Select All Available button at the bottom of the window to automatically include all the modes in the batch auto run process.
Click the Processing Preferences tab and select the option shown next.
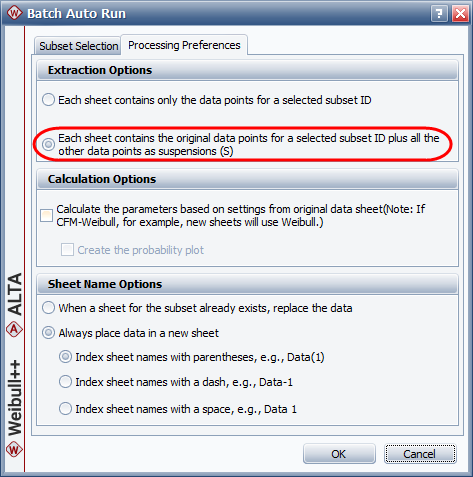
Click OK. The data set for each mode will be extracted to separate data sheets in the folio. Select an appropriate distribution for each failure mode and estimate the parameters for each separate data sheet. (For this example, use the 2P-Weibull distribution and the MLE parameter estimation method for both data sheets).
The next step is to describe the relationships between the failure modes. Add an RBD to the project by right-clicking the RBD folder in the current project explorer and choosing Add Diagram on the shortcut menu.
![]()
This creates a reliability block diagram (RBD) folio, which gives you the ability to create blocks that represent the failure modes. You can use arrows to connect the blocks in an appropriate configuration to describe the relationship between the failure modes and show how each mode can result in a failure for the product. The following RBD shows that the water pump will fail if either the gasket or valve fails.
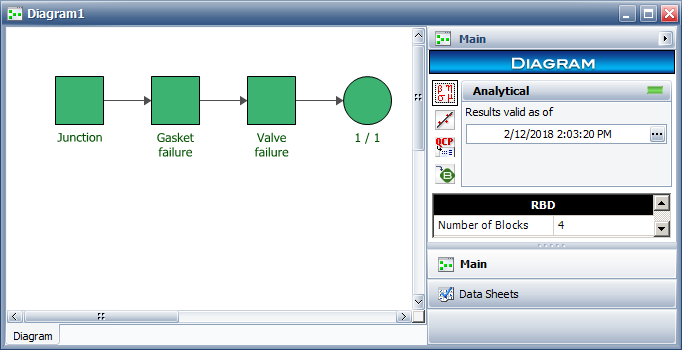
Following are brief descriptions on how to build the diagram shown here. For complete instructions, see Building Diagrams in Weibull++/ALTA.
Add a junction block by choosing Diagram > Blocks > Add Junction. The junction block serves as a unique starting point for the diagram.
Add blocks by choosing Diagram > Blocks > Add Block. You will be asked to select the data sheet of the failure mode that the block will represent.
Add nodes by choosing Diagram > Blocks > Add Node. The nodes act as switches that the diagram paths move through.
Add arrows by choosing Diagram > Settings > Connect Blocks.
To analyze the diagram, choose Diagram > Analysis > Analyze or click the icon on the control panel of the RBD folio.
![]()
All reliability calculations performed via the QCP tool of the RBD folio will be based on the resulting reliability equation of the diagram.
Tip: ReliaSoft's advanced reliability block diagram software, BlockSim, can handle advanced configurations and analyses such as dependent failure modes (i.e., the occurrence of one failure mode affects the probability of occurrence of the other modes).
© 1992-2019. HBM Prenscia Inc. ALL RIGHTS RESERVED.
| E-mail Link |