
|
|
||
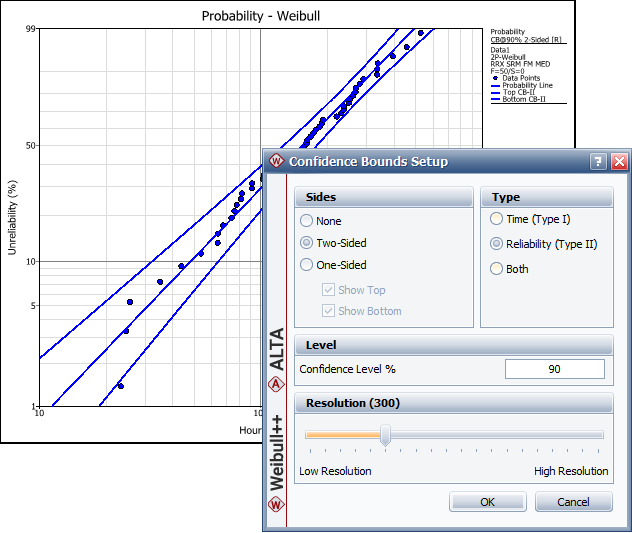
If your analysis includes calculations for confidence bounds, you can display the bounds in the associated plot by clicking the Confidence Bounds link on the plot control panel or by choosing Plot > Confidence Bounds > Confidence Bounds.
![]()
Depending on the type of data you are working with, you may be presented with different options for setting up the confidence bounds on the plot. (The ReliaWiki resource portal provides information on the background theory of confidence bounds at: http://www.reliawiki.org/index.php/Confidence Bounds.)
In the Confidence Bounds Setup window, you will need to:
Select which lines to show on the plot (e.g., two-sided, bottom one-sided, etc.)
Select which type of bounds to show on the plot. This may be the bounds on the time estimate (Type I), bounds on the reliability/unreliability estimate (Type II: Reliability); or when applicable, bounds on functions such as number of failures, growth potential, etc. (Type II: Function).
Enter the percent confidence level.
To change the level of detail at which the bounds are plotted, adjust the Resolution slider. You can click and drag the slider or, for fine adjustments, click the slider and then use the arrow keys. The number of points plotted to create the lines is displayed next to the field name. Note that higher resolutions will take longer to plot.
To hide the confidence bounds, choose Plot > Confidence Bounds > Hide Confidence Bounds.
© 1992-2019. HBM Prenscia Inc. ALL RIGHTS RESERVED.
| E-mail Link |