
|
|
||

In Weibull++, the Bayesian-Weibull analysis method combines the concept of Bayesian statistics with the properties of the Weibull distribution to make predictions about the life characteristics of a product. This type of analysis is particularly useful when there is limited life data for a given product or failure mode but there is a strong prior understanding of the failure rate behavior.
The prior information in the analysis is in the form of a distribution fitted to a range of likely beta values. In the context of life data analysis, the beta parameter is used to define the shape of the Weibull distribution, which reflects the failure behavior of a product (i.e., whether the failure rate increases, decreases or remains constant over time). The range of beta values could be obtained from data for a similar product design or from engineering knowledge. When a distribution is fitted to the range of beta values, the distribution is called the prior distribution of beta and it serves to model the most likely failure behavior of the product.
The ReliaWiki resource portal provides more information about Bayesian-Weibull analysis at: http://www.reliawiki.org/index.php/Bayesian-Weibull Analysis.
Take for example a device that was redesigned for improved reliability. A test performed on the new design produced only a few failures; however, the same failure modes as the original design were observed. To use the Bayesian-Weibull approach, you first need to obtain the prior distribution of beta in order to describe the failure behavior observed for the original design. In Weibull++, there are four distributions available: normal, lognormal, exponential and uniform.
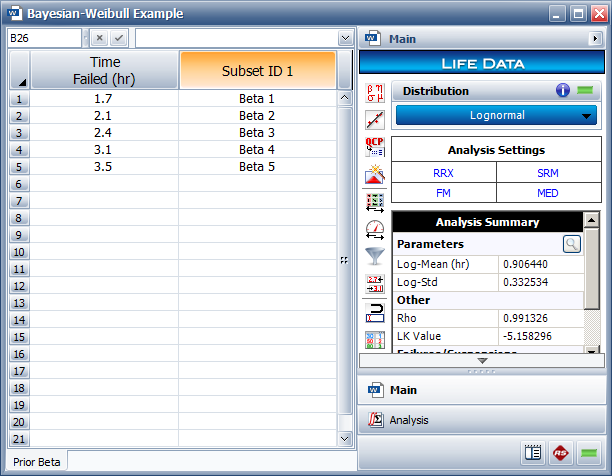
The following example shows a range of known beta values obtained from prior analyses of the original design. The prior distribution of beta is determined to be a lognormal distribution with a log-mean of 0.9064 and a log-standard deviation of 0.3325, as shown next.
Next, collect the current times-to-failure data of the new design and enter the information in a new data sheet, as shown next. On the Main page of the control panel, click the Distribution drop-down list and choose Bayesian-Weibull > B-W Lognormal Prior. Click Calculate. A window similar to the one shown in the inset will be displayed.
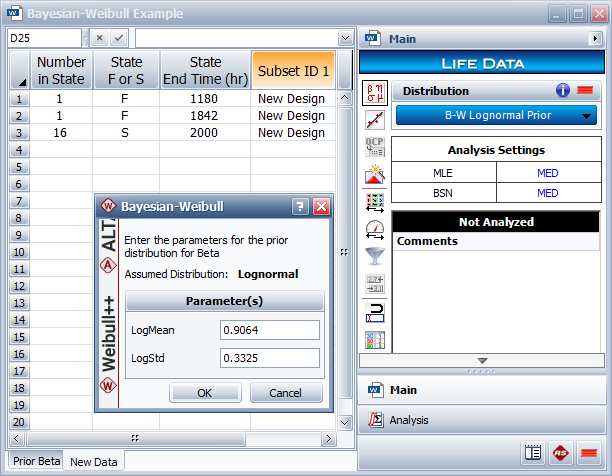
Enter the calculated parameter values of the prior distribution of beta: LogMean = 0.9064 and LogStd = 0.3325. Click OK.
The following figure shows the results of the analysis.
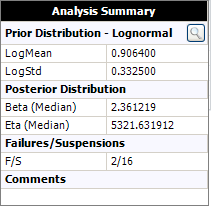
Note that instead of a single calculated value for each of the parameters, the parameters of the Bayesian-Weibull distribution are distributed. This result is known as a posterior distribution. In the example, the result showing that Beta (Median) = 2.3612 means that the median value of the posterior distribution of the beta parameter is 2.3612. For convenience, this is used as the single point estimate for the beta parameter.
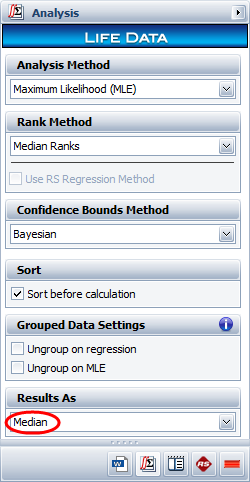
By default, Weibull++ calculates the point estimates from the median value of the posterior distribution. This is because the median value always corresponds to the 50th percentile of a distribution. You have the option to change this setting and calculate the mean value of the posterior distribution instead; however, note that the mean is not a fixed percentile and this could cause issues when comparing results across different data sets. The option to change this setting is available on the Analysis page of the control panel when you choose the Bayesian-Weibull analysis, as shown next.
To obtain point estimates of a metric, such as the probability of failure or the reliability at a given point in time, use the Quick Calculation Pad (QCP). The QCP will automatically compute the metric of interest using the median value of the posterior distribution (or the mean, if you switch the setting on the Analysis page of the control panel).
The following plots show the confidence bounds for the Bayesian-Weibull analysis that incorporates the prior information compared to the confidence bounds of a 2-parameter Weibull analysis of the new design data only. As you can see, the confidence bounds of the Bayesian-Weibull analysis are tighter, which may lead to a more precise analysis of whether the redesign improved the life of the device.
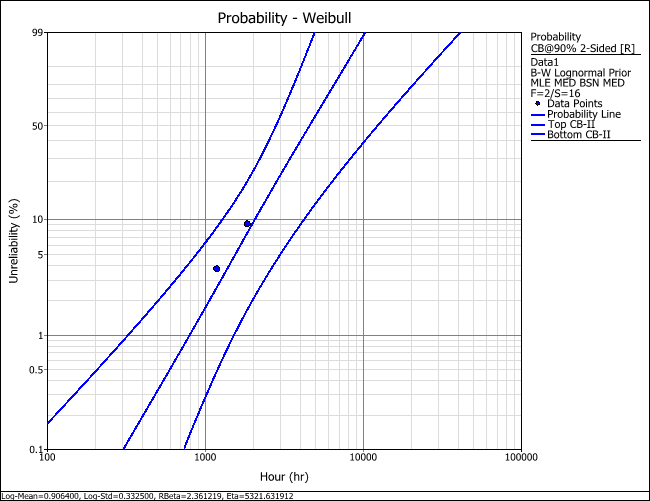
Confidence bounds of the Bayesian-Weibull analysis
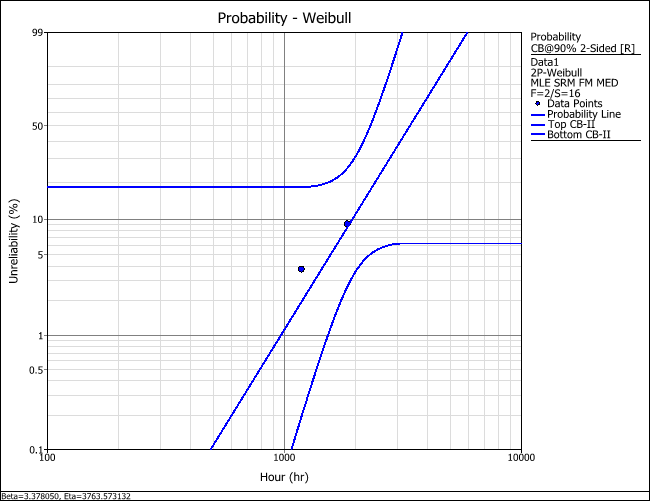
Confidence bounds of the 2-parameter Weibull analysis
© 1992-2019. HBM Prenscia Inc. ALL RIGHTS RESERVED.
| E-mail Link |