![]()
![]()

The ALTA standard folio control panel allows you to configure the analysis settings for the data sheet and view/access the results. It consists of multiple pages, each containing options for performing particular tasks. This topic focuses on the Main page of the ALTA standard folio control panel, which contains most of the tools you will need to perform accelerated life testing analysis. For more information about the control panel in general, see Control Panels.
The Main page of the ALTA standard folio control panel includes the following settings:
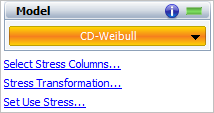
The Model drop-down list allows you to select the life-stress relationship and life distribution that will be used to extrapolate failure behavior at normal operating conditions. The selected life distribution is fitted to the data obtained at each accelerated stress level used in the test, and then the selected life-stress relationship is used to extrapolate the probability density function (pdf) at the use stress level from the pdfs at the accelerated levels.
There are five life-stress relationships to choose from in ALTA Standard and four additional relationships in ALTA PRO. For both versions of ALTA, there are three life distributions to choose from. The choice of the life-stress relationship depends on various factors, including the types and number of stresses used in the test. The ReliaWiki resource portal has more information on the distributions and life-stress relationships at: http://www.ReliaWiki.org/index.php/Accelerated_Life_Testing_Data_Analysis_Reference.
Tip: If you are not certain which life distribution would provide the best fit for your data, you can use the ALTA Distribution Wizard to guide you through the selection process.
Life distributions: 2-parameter Weibull, lognormal (not available with the proportional hazards relationship) and 1-parameter exponential.
Life-stress relationships in ALTA Standard:
Arrhenius: a single-stress model typically used when temperature is the accelerated stress.
Eyring: a single-stress model typically used when temperature or humidity is the accelerated stress.
Inverse power law (IPL): a single-stress model typically used with a non-thermal stress such as vibration, voltage or temperature cycling.
Temperature-humidity (TH): a double-Arrhenius model that is typically used when temperature and humidity are the acceleration variables.
Temperature-nonthermal (TNT): a combination of the Arrhenius and IPL relationships that is typically used when one stress is temperature and the other is non-thermal (e.g., voltage).
Additional life-stress relationships in ALTA PRO:
Generalized Eyring (GER): a variation of the Eyring relationship that is typically used when both temperature and humidity are accelerated.
Proportional hazards (PPH): analyzes data with up to 8 simultaneous stress types using the exponential relationship for each stress. It also allows the use of zero as a stress value, which enables the analysis of data with indicator variables (e.g., 0 = on/off and 1 = continuous operation).
General log-linear (GLL): supports the analysis of data with up to 8 simultaneous stress types and provides the flexibility of specifying the life-stress relationship (Arrhenius, IPL or exponential) for each stress. Like the PPH model, this model also allows for the analysis of data with indicator variables.
Cumulative damage (CD): analyzes data with up to 8 stress types and/or situations where the stress varies with time.
Directly underneath the Model drop-down list are options for selecting the stress columns and, when applicable, the stress transformations that will be used in the analysis, and defining the use stress level for every stress that is selected to be used in the analysis.
The Analysis Summary area displays the calculated parameter values and other values for your selected model. As an example, the following picture shows the analysis results for a particular data set.
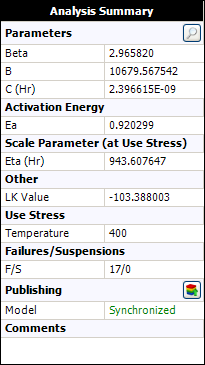
Depending on your application settings, additional information may also be displayed:
The Ea (activation energy) value is displayed when temperature-related models, such as Arrhenius, Eyring, generalized Eyring, temperature-humidity or temperature-nonthermal, are used. It represents the effect of temperature; a large value means temperature has a large effect on the life of the product.
The Scale Parameter value represents the product's characteristic life.
For the Weibull distribution, the characteristic life is equal to the value of the eta parameter (i.e., the time at which unreliability = 63.2%).
For the lognormal distribution, it is equal to Exp(Log-mean) (i.e., the time at which unreliability = 50%).
For the exponential distribution, it is equal to the mean life.
The LK Value (likelihood function value) is the logarithm of the likelihood value for the model parameters. It can help you compare how well different models fit the same data set. The model with the highest LK value is considered to have the best fit statistically for that data. However, because this value is influenced by the sample size and the variability of the data set, it varies across different data sets and cannot be used by itself to evaluate a particular model.
The use stress level of every stress that was used in the analysis.
The number of failures and suspensions in the data set.
The model status (as shown in the previous picture) is displayed if the result of the analysis is associated with a published model. The status "Synchronized" indicates that the published model reflects the latest results from the analysis. If the analysis has been modified since the model was last published (e.g., if more data has been added, an analysis setting has changed, etc.), the status will display as "Out of Sync." (See Publishing Models.)
The following tools may also be used in conjunction with your own engineering knowledge about the model in order to further evaluate the fit of the model to the data set.
The Use Level Probability and Standardized Residuals plots show you how well the solution line tracks the plotted data points. This allows you to visually assess the fit of the selected model.
The Likelihood Ratio Test is used to confirm the assumption of a common shape parameter among the data obtained at the various accelerated stress levels. This assumption underlies the use of any model that includes the Weibull or lognormal life distribution.
Confidence Bounds allow you to quantify the amount of uncertainty in the parameter estimates and other functions, such as reliability predictions, due to sampling error. The narrower the confidence bounds at a given confidence level, the closer the estimates are to the true value of the parameters and the better the precision on the reliability predictions.
You can visualize the confidence bounds by using plots, or you can view the calculated values of the confidence bounds by using the Quick Calculation Pad.
The folio tools are arranged on the left side of the Main page of the control panel. Use these tools to manage data and experiment with the results of your analysis.
![]() Calculate estimates
the parameters of the chosen model, based on the current data set and
the specified analysis settings. This tool is also available by choosing
ALTA > Analysis > Calculate.
Calculate estimates
the parameters of the chosen model, based on the current data set and
the specified analysis settings. This tool is also available by choosing
ALTA > Analysis > Calculate.
![]() Plot
creates a new sheet in the folio that provides a choice of applicable
plot types. For standard folios, this
includes plots such as Use Level Probability, Reliability vs. Time, Life
vs. Stress, etc. You can also create a Plot sheet by choosing ALTA
> Analysis > Plot.
Plot
creates a new sheet in the folio that provides a choice of applicable
plot types. For standard folios, this
includes plots such as Use Level Probability, Reliability vs. Time, Life
vs. Stress, etc. You can also create a Plot sheet by choosing ALTA
> Analysis > Plot.
![]() QCP
opens the ALTA Quick Calculation
Pad, which allows you to calculate results, such as the mean life
and the probability of failure, based on the currently active data sheet.
This tool is also available by choosing ALTA
> Analysis > Quick Calculation
Pad.
QCP
opens the ALTA Quick Calculation
Pad, which allows you to calculate results, such as the mean life
and the probability of failure, based on the currently active data sheet.
This tool is also available by choosing ALTA
> Analysis > Quick Calculation
Pad.
![]() Distribution Wizard
opens the ALTA Distribution Wizard,
which helps you select the life distribution that will best fit your data.
This tool is also available by choosing ALTA
> Analysis > Distribution Wizard.
Distribution Wizard
opens the ALTA Distribution Wizard,
which helps you select the life distribution that will best fit your data.
This tool is also available by choosing ALTA
> Analysis > Distribution Wizard.
![]() Alter Data Type opens
the Data Sheet Setup window,
which allows you to change the data entry columns in the current data
sheet. Note that when you change the setup, you may lose information already
entered in the data sheet. For example, switching the data sheet from
one that supports interval data to one that supports only right censored
data will remove all the inspection times. This tool is also available
by choosing ALTA > Format and View
> Alter Data Type.
Alter Data Type opens
the Data Sheet Setup window,
which allows you to change the data entry columns in the current data
sheet. Note that when you change the setup, you may lose information already
entered in the data sheet. For example, switching the data sheet from
one that supports interval data to one that supports only right censored
data will remove all the inspection times. This tool is also available
by choosing ALTA > Format and View
> Alter Data Type.
![]() Add or Remove Columns
allows you to add/remove columns
for stress levels and unit IDs.
Add or Remove Columns
allows you to add/remove columns
for stress levels and unit IDs.
![]() Change Units opens
the Change Units window, which allows you
to change the units for the time values in the current data sheet.
Change Units opens
the Change Units window, which allows you
to change the units for the time values in the current data sheet.
![]() Auto Group Data opens
the Auto Group Data window, which allows
you to group together identical data points. Grouping data significantly
speeds up calculations when you have a very large data set. This tool
is also available by choosing ALTA >
Format and View > Auto Group Data.
Auto Group Data opens
the Auto Group Data window, which allows
you to group together identical data points. Grouping data significantly
speeds up calculations when you have a very large data set. This tool
is also available by choosing ALTA >
Format and View > Auto Group Data.
![]() Alter Parameters (also
called Alter Parameters w/o Recalculation) allows you to manually alter
the value of one (or more) parameters, while keeping the original values
of the rest of the parameters and the variance/covariance matrix the same.
The LK value, the solution line on plots and all subsequent analyses will
be based on the modified set of parameters.
Alter Parameters (also
called Alter Parameters w/o Recalculation) allows you to manually alter
the value of one (or more) parameters, while keeping the original values
of the rest of the parameters and the variance/covariance matrix the same.
The LK value, the solution line on plots and all subsequent analyses will
be based on the modified set of parameters.
![]() Likelihood Ratio Test
opens the Likelihood Ratio Test
tool, which allows you to assess the assumption of a common shape parameter
across all the stress levels used in the test. This assumption underlies
the use of any model that includes the Weibull or lognormal life distribution.
You can also open this tool by choosing ALTA
> Options > Likelihood Ratio Test.
Likelihood Ratio Test
opens the Likelihood Ratio Test
tool, which allows you to assess the assumption of a common shape parameter
across all the stress levels used in the test. This assumption underlies
the use of any model that includes the Weibull or lognormal life distribution.
You can also open this tool by choosing ALTA
> Options > Likelihood Ratio Test.
![]() Transfer Data to Weibull++
allows you to transfer data
from the ALTA standard folio to a Weibull++ standard folio.
Transfer Data to Weibull++
allows you to transfer data
from the ALTA standard folio to a Weibull++ standard folio.
© 1992-2016. ReliaSoft Corporation. ALL RIGHTS RESERVED.
 |
E-mail Link |