![]()
![]()
Many of the analysis folios, diagram sheets and other interfaces in Synthesis desktop applications utilize a control panel that allows you to make required inputs, initiate the desired analysis or simulation and view/access applicable results. (Control panels are not used in Xfmea, RCM++, RBI, MPC and Lambda Predict, which use the Analysis panel.) This topic describes some features that are common to most control panels, including:
Switching between pages in a control panel.
Hiding/displaying the entire panel.
Using the Identifiers page to record information about the particular analysis.
Using the Publishing page to view and manage the information from the current analysis that is shared throughout the Synthesis Platform.
Using the Notifications page to view the calculation/simulation status for the current folio or diagram, and read any relevant warnings or notes (e.g., calculation errors).
Using the Utilized Resources page (BlockSim only) to view a list of the Synthesis resources that are being directly used by the blocks in the current diagram.
For information about the control panel commands and options that are relevant for a specific type of folio or diagram sheet, please consult the section for that particular interface.
Many control panels and navigation panels (e.g., the navigation panel on the left side of the Resource Manager) contain multiple pages that vary depending on the type of analysis. You can switch between pages by clicking either the large buttons or the small icons at the bottom of the control panel.
The large buttons are displayed in a vertical column; the small icons are displayed in a horizontal row. To change between the button types, point to the horizontal splitter bar above the buttons and drag it up or down. If you drag the horizontal splitter bar to the bottom of the control panel, all of the pages will be accessed by small icons. If you drag it as far up as it will go, all of the pages will be accessed by large buttons. Positions in between allow you to use some large buttons and some small icons.
![]()
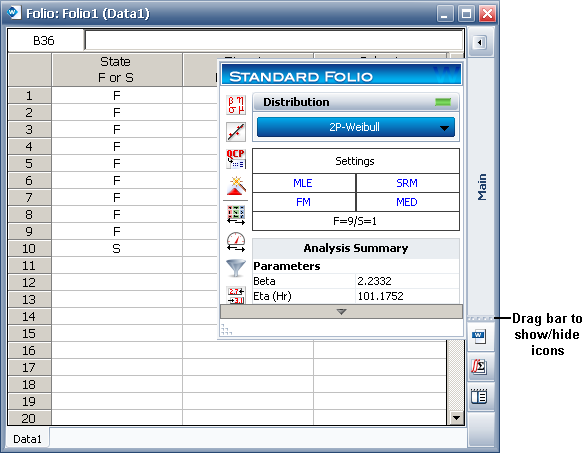
The control panel can be toggled between hidden and displayed states by clicking the Hide or Show icon in its title bar, as shown below using a Weibull++ standard folio as an example.
![]()
When the control panel is hidden, a bar representing the control panel will be displayed on the right side of the window, as shown next. The label in the vertical bar indicates which page of the control panel is currently active ("Main" in this case). When you click the bar, the page will be displayed temporarily. When you click anywhere outside of the control panel page, it will be automatically hidden again.
Certain analyses can be published as models that become resources available for other analyses. For example, you could perform a life data analysis in Weibull++, publish the results as a model, and then use that model to describe the reliability of an item in RCM++.
The Identifiers page of the control panel allows you to enter specific information (e.g., name, part number, etc.) that will be associated with the model when it is published. This will help you to search for the model when you need to use it in another analysis. These identifiers are also available via the Item Properties window.
You can enter up to 1,000 characters of text in these fields; if the text is too long to be displayed in the field, you can click the arrow at the bottom of the field to show the remaining text.
The Publishing page allows you to view and manage information from the current analysis that is shared throughout the Synthesis Platform.
Model/Fitted Model – allows you to publish or update a model based on the current analysis. See Publishing Models.
SEP Summary – is available only if your organization has implemented a web-based Synthesis Enterprise Portal (SEP) for the enterprise database. Use these commands to publish or remove a web-based summary of the current analysis. See Synthesis Enterprise Portal.
Metrics – shows all of the metric resources that are associated with the current analysis. See Showing Metrics in Folios/Diagrams.
The Notifications page is available in the control panel for certain types of analyses. The Current Status field provides information on the analysis status of the folio. This information will match the color of the status icon used for the Notification page; a green light indicates that the folio has been analyzed, and a red light indicates that the folio has not been analyzed since changes were last made to it.
The Latest Notifications area of the page can display warnings and errors generated during analysis. To clear the display, click the Clear icon.
![]()
You can copy a warning to the Clipboard by clicking the warning and then clicking the Copy icon. The text will then be available to be pasted into other windows or other applications.
![]()
You can also export the contents of the Latest Notifications area to an Excel file by clicking the Export to Excel icon.
![]()
In BlockSim only, the diagram control panel contains a Utilized Resources page. This page displays a grouped list of all of the resources that are used directly by blocks in the diagram (i.e., not applied via any other resource or tool). For example, a URD that is assigned to a block will be displayed in this list, but the model assigned to the URD will not be shown, nor will any tasks assigned to the URD. Similarly, if a block belongs to a maintenance group, that maintenance group will be shown in the list. However, if a block has a state change trigger, the maintenance group(s) used for that trigger will not be shown in the list unless some block in the diagram belongs to them.
This list is not updated automatically; if you have made changes to the diagram, you can click the Refresh icon to update the list.
![]()
You can double-click a resource in the list to open its properties window for viewing or editing. You can also click the Resource Manager icon to view/manage all of the resources available in the project.
![]()
© 1992-2016. ReliaSoft Corporation. ALL RIGHTS RESERVED.
 |
E-mail Link |