
| Related Topics: | ||
Surface plots are 3-dimensional plots that show how the combined levels of two selected factors affect the selected response. The two factors are represented on the two axes on the bottom of the plot, and the response is represented on the vertical axis.
These plots are 3-dimensional versions of contour plots, and thus they are available whenever a contour plot is available. To create a surface plot, choose Plot > Surface Plot or click the icon on the Analysis Plot control panel.
![]()
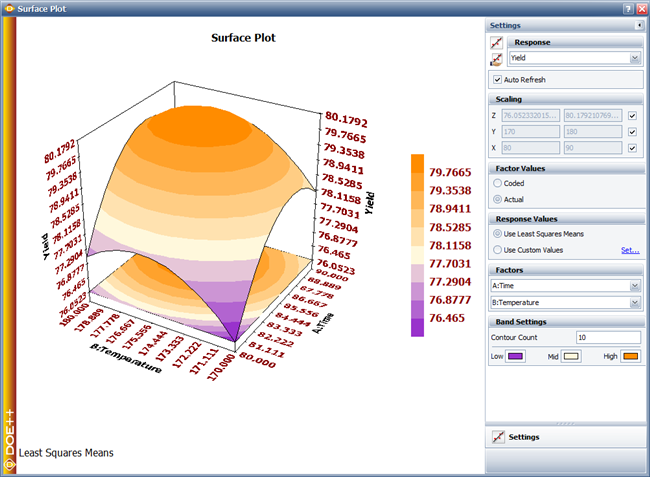
The Surface Plot window will appear as shown next. To make changes to the plot, use the control panel or the Surface Plot Setup window.
© 1992-2015. ReliaSoft Corporation. ALL RIGHTS RESERVED.