
| Related Topics: | ||
The control panel on the Analysis Plot tab may include the following options.
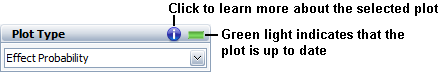
The Plot Type drop-down list provides a choice of applicable plots. To learn more about the selected plot, click the blue (i) icon. This area also contains an indicator light that displays the status of the plot sheet in relation to the analysis it is associated with. If the light is green, then the plot reflects the current analysis. If the light is red, then you will have to update the plot by refreshing it and/or reanalyzing the selected response.
The Response drop-down list allows you to choose which response to display on the plot. Note that only responses that have been analyzed in the folio will be available.
Auto Refresh automatically updates the plot to reflect any changes that have been made. When this option is cleared, you must click the Redraw Plot icon to refresh the display.
Keep Aspect Ratio maintains the ratio of the horizontal size to the vertical size of the plot graphic when you resize the plot sheet.
In the Scaling area, the X and Y Scaling boxes show the minimum and maximum values for the x- and y-axes. You can change these values if the check box beside the value range is not selected. If it is selected, the application will automatically choose appropriate values for the range. (For some plots, the scaling is fixed and so this area will not be available.)
In addition, the following options are specific to the different categories of plots available in the design, multiple linear regression, one-way ANOVA and free form folios.
Level Plots
Contrasts allows you to select the paired comparison of factor levels to be displayed on the comparison chart.
Factor Levels allows you to select the factor levels for the pdfs that are displayed on the mean pdfs plot.
Effect Plots
Effects, ANOVA Effects, Likelihood Terms, Factors and Terms allow you to select the factor(s), effect(s) or term(s) that will be displayed in a chart or plot.
For the term effect plot, the Terms area allows you to specify the order of terms you want included in the plot. For example, you can include only the Main Effects, where only the individual effects of the factors (e.g., A, B, C ...) will be plotted. You can also include the 2-Way Interactions, where the plot will include the second order effects, or two-way interactions (e.g., AB, AC, BC ...). If you want to include only significant terms in the plot, click the Select Significant Terms button above this area.
Scale Type allows you to select how effects will be displayed on the effect probability plot.
Choose Normal to display the negative and positive value effects (coefficients). The negative effects will be shown on the left side of the probability line.
Choose Half-normal to display the absolute values of all effects, which allows you to compare the size of each effect. The significant effect will display only on the right side of the probability line.
Response Values allows you specify how means will be calculated for plots that display mean response values. In some cases, a drop-down list will be available that allows you to select the type of mean value that is used. Fitted Means uses the mean values from the fitted regression model and Data Means uses the mean values from the data entered on the Design tab. (If a transformation has been applied to the response during analysis, data means will be based on the transformed values.) Note the following:
For response surface method designs, plots using fitted means will include curvature, while plots using data means will not.
For reliability designs, this drop-down list is unavailable because only fitted means (the life characteristic) can be plotted; thus, this drop-down is unavailable. By extension, if the data sets selected for inclusion in an overlay or side-by-side plot include one or more reliability designs, this drop-down is unavailable.
When the plot uses fitted means to calculate the response for a particular factor, the following options will be available, allowing you to specify how the blocks, if any, and other factors will be handled when calculating the response. Note that these options are not available in overlay or side-by-side plots, which always use least squares means.
If Use Least Squares Means is selected, the other factors will be set to 0 (i.e., removed from the response calculation).
If Use Custom Values is selected, click the Set link to open the Set Custom Factor Values window, which allows you to manually specify the block value and the values of the other factors.
Interaction allows you to specify the two factors that will be used to generate the interactions plot.
Cube Factors allow you to specify the factors that will be used to generate the cube plot. Note that you can select None in the third drop-down list to generate a 2-dimensional plot.
The following settings apply only to the contour plot.
Contour Factors allows you to select the two responses that will be shown in the plot.
The Contour Options area is on the Additional Settings page of the control panel. The colors for low, medium and high response values can be modified by clicking the colored Low, Mid and High icons. You can also change the Resolution of the contours (higher resolution means smoother lines between contours).
The Band Settings area is also on the Additional Settings page. Three options are available.
Select Count to enter the number of contours in the Contour Count field. More contours means more fine-grained results (i.e., more colors for marking response ranges). The minimum and maximum response values are set by the software automatically.
Select Range manually set the minimum and maximum response values to be used in the plot. Then enter the Increment that will be used to create the contours. A lower increment means more fine-grained results (i.e., more colors for marking response ranges).
Select Values to define each contour manually. For example, if you enter the values 2 and 3, then the plot will have three contours: one for values less than 2, another for values between 2 and 3, and another for values greater than 3. Use the [+] and [-] icons in the Contour Values area to add a new value or remove a selected one.
Residual Plots
Residual Type (not available for the fitted vs. actual plot) allows you to select the residual type to display on the plot. The options include:
Regular Residuals is the difference between the observed Y and the predicted Y.
Standardized Residual is the regular residual divided by the constant standard deviation.
Studentized Residual is the regular residual divided by an estimate of its standard deviation.
External Studentized Residual is the regular residual divided by an estimate of its standard deviation, where the observation in question is omitted from the estimation.
Residual Factor allows you to select the factor that will be displayed in the residual vs. factor plot.
Residual Histogram Settings
Custom Bins allow you to specify the number of groups, or bins, into which the residuals will be divided. Otherwise, DOE++ will calculate a default number of bins based on the number of observations.
Select Superimpose pdf to superimpose the probability density function line on the bars.
Auto-Correlation Options
Custom Lags allows you to specify the number of lags used in the plot. You may have up to n-1 lags, where n is the number of observations. If this option is not selected, DOE++ will use the default number of lags, which is n/4.
The folio tools for plots are arranged on the left side of the control panel:
![]() Redraw
Plot updates the plot to reflect any changes that have been made.
Redraw
Plot updates the plot to reflect any changes that have been made.
![]() Plot Setup opens the
Plot Setup window, which allows you to customize
most aspects of the plot including the titles, colors, sizes, etc.
Plot Setup opens the
Plot Setup window, which allows you to customize
most aspects of the plot including the titles, colors, sizes, etc.
![]() RS Draw
launches ReliaSoft Draw, which allows
you to view the plot in greater detail, add annotations and modify selected
plot elements.
RS Draw
launches ReliaSoft Draw, which allows
you to view the plot in greater detail, add annotations and modify selected
plot elements.
![]() Surface Plot opens a window with a 3-dimensional surface plot for the currently selected response, when such plots are available.
Surface Plot opens a window with a 3-dimensional surface plot for the currently selected response, when such plots are available.
© 1992-2015. ReliaSoft Corporation. ALL RIGHTS RESERVED.