
| Related Topics: | ||
Side-by-side plots allow you to view multiple plots at a time in a single window. To add side-by-side plot to a project, choose Insert > Reports and Plots > Add Side-By-Side Plot.
![]()
The Select Folio Response(s) window will appear, allowing you to select the response to be associated with the side-by-side plot from calculated data sets in any folio in the project that is used to analyze data (i.e., all folios except the optimization and experiment simulation folios).
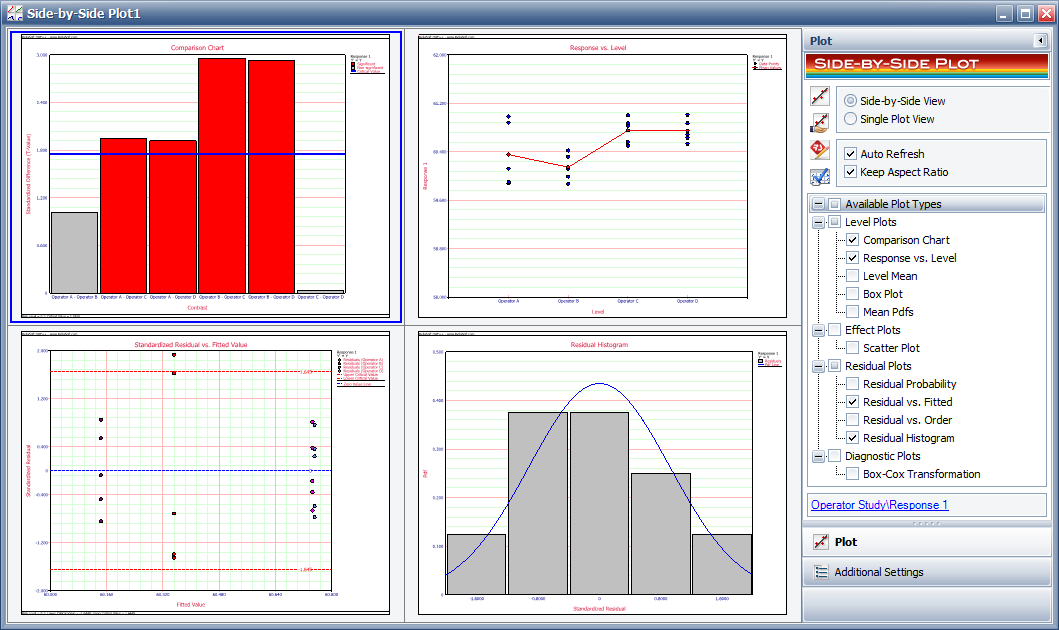
To view a single plot in greater detail, or to change the settings specific to that plot, double-click the plot to display it by itself. Double-click the plot again to return the window to the side-by-side view. (Alternatively, you can use the Side-by-Side View and Single Plot View options near the top of the control panel.) Any changes you make in the Plot Setup window, except for changes to titles, will apply to all the included plots. The side-by-side plot window is shown next.
© 1992-2015. ReliaSoft Corporation. ALL RIGHTS RESERVED.