![]()
![]()
The design folio control panel includes a tool that allows you to evaluate your design and compare it to other designs. By evaluating a design before you implement it, you can avoid using time or resources on an inefficient experiment. For example, if the tool shows that a design is unlikely to detect any main effects, you can increase the numbers of replicates and re-evaluate before performing the experiment. If you have already implemented a design, you can enter the response data and calculate it before performing the evaluation, which will produce more accurate results.
Specifically, the design evaluation tool allows you to:
Calculate the design's power given a specified amount of effect. The power is the probability of detecting a specified amount of effect.
Calculate the amount of effect given a specified power. The amount of effect is the largest difference between the response means obtained at each factor or effect level.
Inspect the design's alias structure. This shows which effects are aliased with each other, and thus it helps you make sure you aren't losing any important information about interaction effects due to aliasing.
Determine whether the design is orthogonal (i.e., the analysis of an effect does not depend on what other effects are included in the model). Orthogonal designs are ideal because they have minimal variance for the estimated model coefficients.
If the design is not orthogonal, you can compare the design's optimality to other proposed designs to see which one is more similar to an orthogonal design.
IMPORTANT: This tool assumes that the response values obtained from the experiment will follow a normal distribution. Thus, it is not applicable to R-DOE, which is intended for life data that is not normally distributed.
For an example of how you can use this feature to compare two designs, see Design Evaluation Example.
The Design Evaluation tool is available on both the Design tab and the Data tab.
If you evaluate a design from the Design tab, the tool will evaluate the overall design without considering any response-specific settings.
If you evaluate a design from the Data tab, the tool will evaluate the design for a specific response and take into account all relevant settings (and data, if entered and calculated) specific to that response.
Use the Evaluation Settings page of the control panel to configure the evaluation. The page will differ slightly depending on which tab you access it from, as shown next.
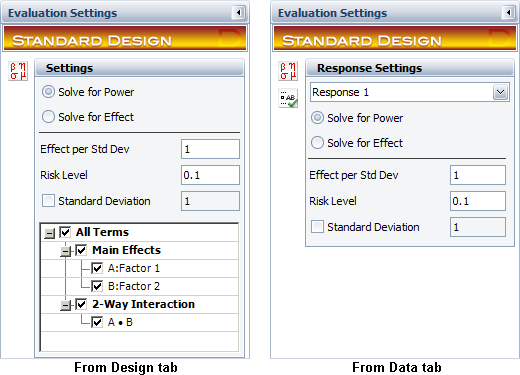
Follow the steps below to define the evaluation settings.
If you accessed the tool from the Data tab, choose a response from the Response Settings drop-down list. The settings you choose will apply to that response only. When accessed from the Design tab, the tool will assume all responses have the same settings.
Choose a metric to solve for.
If you choose to Solve for Power, you will be required to specify the amount of effect in the Effect per Std Dev field.
The effect per standard deviation defines how much the effect exceeds the response variation due to noise (i.e., standard deviation). For example, if you want to know the probability of detecting an effect that is 1.5 times greater than the response's standard deviation, you'd enter 1.5.
If you choose to Solve for Effect Value, the software will calculate an amount of effect given the Value of Power that you provide (e.g., if the probability of detecting an active effect is 90%, enter 0.9).
Enter a Risk Level, which is a measure of the risk that the results of analyzing the response data are incorrect (i.e., alpha = 1 - confidence level).
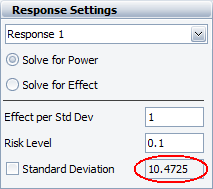
The Standard Deviation represents the response variation that is due to noise. The default value is 1, but if you access the tool from the Data tab and then enter and calculate the response data, the default value will become the calculated standard deviation for the selected response.
Note that the detection power is calculated in terms of the effect per standard deviation (i.e., the amount by which the effect exceeds the standard deviation, whatever it is), so the standard deviation itself does not affect the calculation when you solve for power. However, in this case, the total effect (Effect per Std Dev * Standard Deviation) will be shown in the Power Study table in the detailed results.
If you access the tool from the Design tab, the area at the bottom of the page will allow you to select the terms that will be used in the evaluation. For example, if you were not interested in investigating the interaction between factors A and B, then you would you clear the A · B check box. When accessed from the Data tab, the tool will use the same terms you selected in the Select Terms window.
After you select the desired settings, go to the Main page of the control panel and click the Calculate icon in the Design Evaluation area.
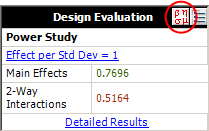
The value you selected to solve for (i.e., power or effect) will appear in the area as shown above. In this example, the probability of detecting the given amount of effect is 79.96% for main effects and 51.64% for 2-way interactions. Note that when there are multiple effects, this value refers to the effect that is the least likely to be detected. (For example, if there are two main effects A and B, and the probability of detecting A is 50% and for B it's 60%, then the Main Effects row will show 0.5000.)
To see more details concerning the evaluation (including the powers calculated for individual effects of interest), click the Detailed Results link at the bottom of the area to view the Evaluation Results window.
© 1992-2017. HBM Prenscia Inc. ALL RIGHTS RESERVED.
 |
E-mail Link |