
The Synthesis Enterprise Portal (SEP) allows users throughout your organization to view FMEAs and published reports that were created in ReliaSoft XFMEA/RCM++/RBI - without having the desktop applications installed. With many new and enhanced features in Version 2018, it's more convenient than ever for managers and stakeholders to access key FMEA details from any web-enabled device.
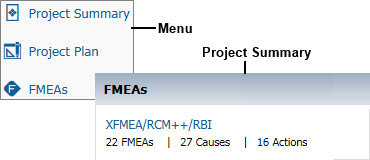
The FMEAs link in the menu opens the FMEAs page for the project that is currently active for you in SEP. This link also appears in the Project Summary page if the project contains FMEA data.
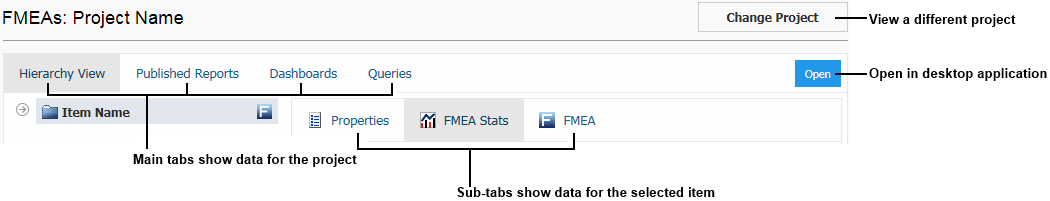
Use the main tabs at the top of the page to navigate between the Hierarchy View, Published Reports, Dashboards and Queries for the current project.
In the Hierarchy View, select an item in the system hierarchy (left/top) and use the sub-tabs (right/bottom) to navigate between the item properties, FMEA stats and FMEA hierarchy for that item.
If you want to view the FMEAs from a different project, click the Change Project button at the top of the FMEAs page.
If you want to view the full analysis in a desktop application, click Open.
The Hierarchy View tab shows the system hierarchy, item properties and any FMEAs that have been created in the desktop applications. (See System Hierarchy and FMEA Analysis in the XFMEA/RCM++/RBI documentation.)
The item properties are always displayed in the Properties tab. When an item has an FMEA, the ![]() icon displays in the system hierarchy and you can view the summary report on the FMEA Stats tab or the full analysis on the FMEA tab.
icon displays in the system hierarchy and you can view the summary report on the FMEA Stats tab or the full analysis on the FMEA tab.
The FMEA Stats report provides a quick at-a-glance summary of key statistics and charts for the item that is currently selected in the system hierarchy. If you select an item that has both a system FMEA and component FMEAs, you can view a report for the system FMEA only or a report that combines the data from all component FMEAs. (See FMEA Stats in SEP.)
The FMEA hierarchy displays the full analysis for the item that is selected in the system hierarchy. To specify which columns display for any FMEA that you view in SEP, click ![]() . In the Customize FMEA Columns window:
. In the Customize FMEA Columns window:
Columns that are not enabled in the current project are shown in gray text.
Select the Enable Priority Highlights check box if you wish to use color to highlight issues based on priority. This feature uses configurable logic that is saved with each project. (See FMEA > RPNs in the XFMEA/RCM++/RBI documentation.) In SEP, the colors can be displayed in the FMEA hierarchy and in query results for effects and causes (if the relevant column(s) are displayed).
To view the full properties for a record in the FMEA hierarchy, click ![]() .
.
The FMEA change log is an optional feature that can be activated and managed via the desktop applications. (See Change Logs and Electronic Approval Tracking in the XFMEA/RCM++/RBI documentation.)
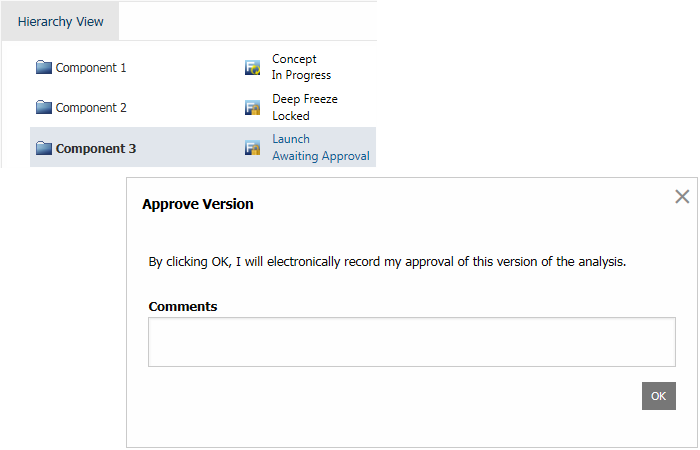
If a change log has been activated for an FMEA, the name of the current version will show in the SEP's system hierarchy. This is visible to all users.
If you are an assigned approver for the current version and it is ready for you to review and approve, this is a link (blue text) that opens a window where you can electronically record your approval.
The Published Reports tab displays the reports generated in desktop applications that have been saved with the project (in Word, Excel or PDF format). This allows both desktop and SEP users to view/print the same report documents. (See Save/Publish Reports in the XFMEA/RCM++/RBI documentation.)
The Dashboards tab displays the dashboard layouts that have been predefined in desktop applications for FMEA data. Each dashboard can include data from all FMEAs in the current project. (See FMEA Dashboards in the XFMEA/RCM++/RBI documentation.)
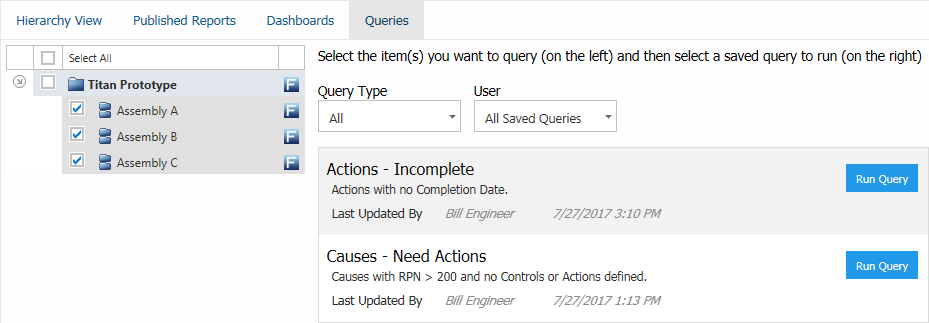
The Queries tab allows you to run queries that have been predefined in desktop applications for item properties and FMEA data This provides a quick way to get customized output based on the latest data from any analysis, such as a list of actions that are not complete, failure modes with high PRNs, and more. (See Query Templates in the XFMEA/RCM++/RBI documentation.)
You can select to run:
Private query templates that you personally saved.
Public query templates that are available to all database users.
Note that the SEP only displays query templates for items and FMEA data. It does not display queries for other types of analyses that are not visible in SEP, such as control plans or p-diagrams.
Select the item(s) that contain the data you want to query (on the left/top), select a saved template (on the right/bottom), then click Run Query.
In the Results page, the top section displays a summary of the criteria that were defined in the query template.
Criteria match all rows is an "AND" query that returns records that match all criteria.
Criteria match any row - an "OR" query that returns records that match any of the specified criteria.
Click inside a column header to sort by that field.
If you want to save or share these results with others, use the Save URL, Copy URL and E-mail URL links at the top of the web page, or copy/paste the URL from the browser's address bar.
In an enterprise database that has an XFRACAS website, users with required permissions can "associate" items and failure modes in XFMEA/RCM++/RBI with template parts and failure modes in XFRACAS. (See Import or Sync from XFRACAS in the XFMEA/RCM++/RBI documentation.)
The ![]() icon in the system hierarchy indicates that the item is associated with an XFRACAS template part. In such cases:
icon in the system hierarchy indicates that the item is associated with an XFRACAS template part. In such cases:
To view all XFRACAS incidents, problems or failure analyses that have been reported for an item, click the ![]() icon in the system hierarchy. A record will appear in this list if the part is identified as the "Responsible Part" for an incident, the "Part Category" for a problem or the "Repaired/Replaced Part" for a failure analysis.
icon in the system hierarchy. A record will appear in this list if the part is identified as the "Responsible Part" for an incident, the "Part Category" for a problem or the "Repaired/Replaced Part" for a failure analysis.
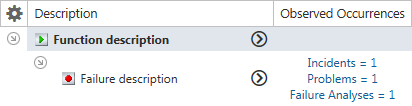
To view the quantity of XFRACAS records that have been reported for an item and failure, make sure the Observed Occurrences column is displayed in the FMEA hierarchy. If records have been reported for a particular failure, click inside the cell to view the specific record IDs.
Note: The XFRACAS reports displayed in SEP are generated based on the standard report templates defined in XFRACAS for incidents, problems or failure analysis reports, with query criteria added "on the fly" to return results for a particular item and/or failure mode. Since the criteria is not saved with the template, you will not be able to "watch" the report. Likewise, you will not be able to use the URL that is visible in the results page to generate the exact same results again. To see the results again, you must click the link generated within SEP.
© 1992-2018. HBM Prenscia Inc. ALL RIGHTS RESERVED.
 |
E-mail Link |