
Available only in the Synthesis Enterprise Portal (SEP), the FMEA Stats report provides a quick at-a-glance summary of key statistics and charts for an FMEA or a group of FMEAs that were created in desktop applications.
To navigate to this report from within SEP, go to the FMEAs page for the project and, on the Hierarchy View tab, select an item in the web system hierarchy. If the report is not displayed by default, click the FMEA Stats tab.
To get a link to this report from within XFMEA/RCM++/RBI, select an item in the desktop system hierarchy and choose System Hierarchy > Current Item > Web Summary > Open in SEP or E-mail SEP Link.
![]()
Depending on the item that is selected in the system hierarchy, you may be able to select one or both of these check boxes:
Current Item shows data from the selected item's FMEA.
Sub-Items shows data from the FMEAs for the selected item's sub-items.
For example, if there is both a system FMEA and component FMEAs, you can review a report for the system FMEA only or a report that combines the data from all of the component FMEAs.
If you select to show data from the current item only (not sub-items) and a change log has been activated for the FMEA, the report displays the name of the current version and one of the following statuses:
In Progress - a revision to the analysis is currently in progress.
Locked - the analysis is locked for editing and there are no assigned approvers.
Awaiting Approval - the analysis is locked for editing and one or more assigned approvers still need to review.
Approved - the analysis is locked for editing and all of the assigned approvers have electronically recorded their approval.
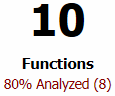 The large numbers display the quantity for each record type and, when applicable, the percentage of those records that are analyzed or completed. In this report, Analyzed means that the branch has at least one function, failure, effect and cause, and ratings are assigned to the effects and causes, if applicable.
For example, if the project is configured to calculate both initial and revised RPNs, a failure is "analyzed" if it has at least one effect and at least one cause, all of its effects have both initial and revised severity, and all of its causes have both initial and revised occurrence and detection.
For actions, Completed means that an actual completion date has been entered.
if the project is configured to use RPN metrics, the report will display the top failure causes. Use the check boxes to specify whether you want to view a pareto (bar) chart based on RPN, SxO or both.
If the project is configured to include actions in the FMEAs, the report will display a list of the FMEA actions along with:
Completion Status pie chart based on the number of actions that are completed, in progress, not started or past due.
Progress bar based on the total planned duration, the actual duration for closed actions and the percent completed for open actions. For example, if Action 1 (duration = 3 days) is complete and Action 2 (duration = 2 days) is still in progress but marked 50% complete, the overall progress is 80% (4 out of 5 days).
© 1992-2018. HBM Prenscia Inc. ALL RIGHTS RESERVED.
 |
E-mail Link |