![]()
![]()
If your organization chooses to implement a web-based Synthesis Enterprise Portal (SEP) for an enterprise database, the entire team – including managers and colleagues who don't have Synthesis desktop applications installed – will have the opportunity to access key analysis and project management details from any web-enabled device.
In Version 11, the website has a completely redesigned interface with more at-a-glance summaries and better usability on mobile devices.
This topic provides an overview of what's available in the Version 11 SEP website. For more information, see:
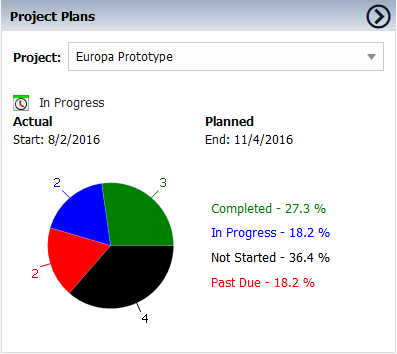
Completely redesigned in Version 11, the personalized SEP home page provides an intuitive, at-a-glance overview of the information you’re tracking via the website, such as actions, recent messages, reports, metrics and more.
For example, this panel shows the status of the gates and actions for the project plan that is currently active for you in SEP. Use the drop-down list to choose a different project or click ![]() to see the full project plan.
to see the full project plan.
You can choose which panels are displayed in your own home page, and also change the order (see Customizing the SEP Home Page).

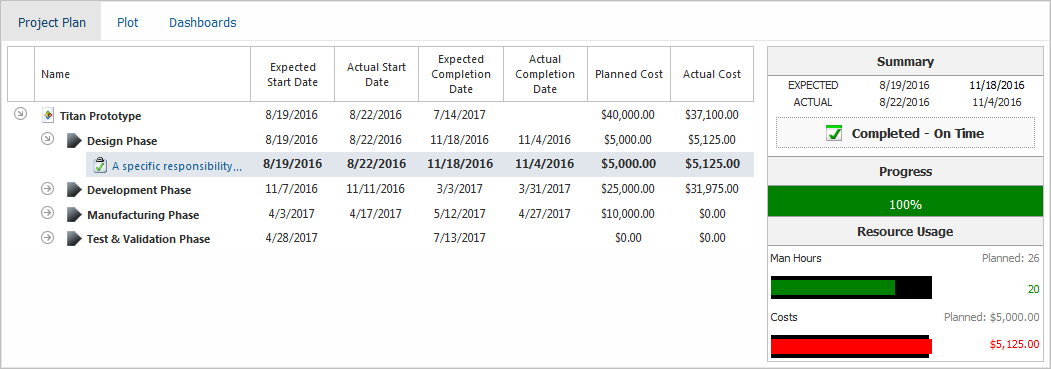
The SEP website shows a streamlined view of the project plan for each project you have permission to view. Project plans are created and edited via the Synthesis desktop applications (except MPC) and the website always displays the most recent information from the plan.

New in Version 11, the "My Projects" feature makes it easy to access the projects that you frequently need to view in SEP (see My Projects in SEP).
![]() The SEP website allows you to create, view and edit the same actions and portal messages that are visible to you from the desktop applications (see Portal Messages and Managing Actions in SEP).
The SEP website allows you to create, view and edit the same actions and portal messages that are visible to you from the desktop applications (see Portal Messages and Managing Actions in SEP).
Redesigned in Version 11, the web interfaces now offer better display from mobile devices, and more capabilities (including links/attachments).
The SEP website shows a summary from each analysis project you have permission to view. This may include:
The overall status of the project plan, and all of the actions (from FMEAs, the project plan or standalone) that are being tracked for the project.
The KPIs (metric resources) that have been defined for the project.
The analysis summaries and reports that have been published to SEP from Weibull++/ALTA, BlockSim/RENO, RGA or Lambda Predict (see Publishing to SEP).
All of the files and website resources that have been linked or attached to the project.
The SEP website shows the system hierarchies and FMEAs created in Xfmea/RCM++/RBI. The website always displays the most recent information from the project.
You can also access any generated reports that have been published to the website in Word, Excel, PDF or HTML format (see Save/Publish Reports in the Xfmea/RCM++/RBI documentation).

![]() Redesigned in Version 11, the "Watch This Report" feature makes it easier to manage the specific dashboards and reports you want to be able to access quickly via the SEP website. This includes:
Redesigned in Version 11, the "Watch This Report" feature makes it easier to manage the specific dashboards and reports you want to be able to access quickly via the SEP website. This includes:
A wide variety of graphical dashboards based on predefined layouts for different types of data (project plans, Synthesis Explorer, simulation diagram results, FMEAs or Synthesis Data Warehouse).
A flexible, web-based "spreadsheet viewer" and "document viewer" for Synthesis Workbook reports that have been published to SEP.
For details, see Dashboards & Reports in SEP.
The SEP website shows all of the KPIs (metric resources) that have been created in desktop applications for the projects you have permission to view – no publishing required.
Redesigned in Version 11, the metrics are now easier to scan "at-a-glance" to help you monitor performance and support decision making.

The SEP website shows all of the Synthesis Explorer or Synthesis Data Warehouse (SDW) dashboards that have been predefined in the desktop applications.
Synthesis Explorer dashboards provide a flexible way to explore all the different analyses that are stored in the Synthesis repository (e.g., application source, analysis type, created by, last update, etc.).
SDW dashboards present charts and results from any of the data collections or custom connections that have been created in Weibull++/ALTA or RGA. This can include data extracted from ReliaSoft's XFRACAS or from external databases and systems (CMMS, EAM, etc.).
ReliaSoft's XFRACAS is a highly configurable web-based failure reporting, analysis and corrective action system (FRACAS) with integrated capabilities for part tracking, root cause analysis and team-based problem resolution.
If your organization implements both the SEP and XFRACAS websites for the same enterprise repository, the SEP can include links to the XFRACAS reports, charts, actions and incidents of particular interest to each user (see SEP and XFRACAS).
© 1992-2017. HBM Prenscia Inc. ALL RIGHTS RESERVED.
 |
E-mail Link |