![]()
![]()
| Related Topics: | ||
Side-by-side plots allow you to display different plots for a single data set all in a single window for easy comparison. In Weibull++, you can select to plot the data set using multiple distributions or plot types. In ALTA Standard and ALTA PRO, you get a third option to plot the data set using multiple life-stress relationship models.
To add a side-by-side plot to a project, choose Insert > Reports and Plots > Side-by-Side Plot or click the icon on the control panel of the folio plot sheet.
![]()
To view a single plot in greater detail, double-click the plot. You can double-click the plot again to return to the side-by-side view. The following picture shows an example of a side-by-side plot in Weibull++. Note that any cosmetic changes you make to a plot will be applied to all plots in the side-by-side view.
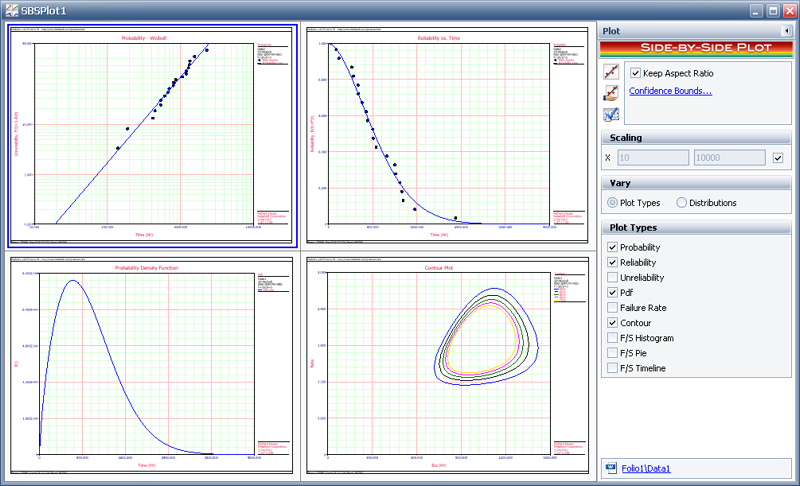
The control panel in a side-by-side plot is similar to the control panel in standard plots, except for two things:
You can select which data sheet to plot by clicking Select Data Sheet on the control panel.
![]()
You have two choices for displaying the plots. You can either:
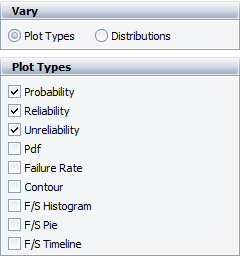
Display several plot types for the selected data set. To do this, select the Plot Types option in the Vary area of the control panel, and then select the check box for each plot type of interest, as shown in the following example for Weibull++. (Note that for degradation and warranty folios, the plots are based on the extrapolated data set.)
Display several instances of the same plot type, where each instance shows the data set fitted with a different life distribution/model. To do this, select the Distributions option in the Vary area of the control panel. Select one plot type, and then select the check box for each distribution you wish to plot. Note that regardless of your choices, the side-by-side plot will display only those distributions that can be successfully calculated. You will see notification messages for any unsuccessful calculations.
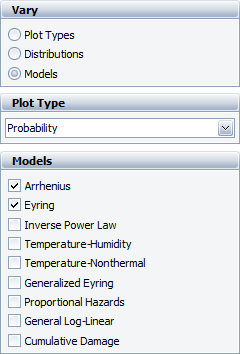
ALTA includes a third option to vary the Models, as shown in the example below. If you select to vary the models, each plot will use the life distribution currently used in the selected data sheet in combination with the selected models. Similarly, if you select to vary the distributions, each plot will use the life-stress relationship currently used in the selected data sheet in combination with the selected life distributions.
© 1992-2015. ReliaSoft Corporation. ALL RIGHTS RESERVED.