![]()
![]()
| Related Topics: | ||
The control panel in the plot sheet allows you to control the options that go along with the plot. The options available in the control panel vary depending on the type of folio or tool that the plot is associated with. A table showing the available options for each folio or tool follows.
Note: Unless otherwise stated, all options apply to both Weibull++ and ALTA.
The control panel tools include the following options:
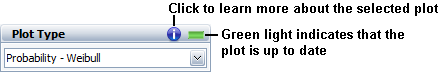
The Plot Type drop-down list provides a choice of applicable plots. To learn more about the selected plot, click the blue (i) icon. This area also contains an indicator light that displays the status of the plot sheet in relation to the analysis it is associated with. If the light is green, then the plot reflects the current analysis. If the light is red, then you will have to update the plot by refreshing it and/or reanalyzing the associated data sheet. For more information about the available plot types, refer to the specific topic covering the data sheet type or diagram.
Units allows you to choose which units you want the plot to show from the drop-down menu.
Auto Refresh automatically updates the plot to reflect any changes that have been made. If not selected, you must click the Redraw Plot icon to refresh the display.
Keep Aspect Ratio: the proportion of horizontal size to vertical size will remain constant when you resize the plot. Note that changing this option will also change it in the Page Setup window for the plot.
Logarithmic Axes plots the function on a log-log paper.
Confidence Bounds opens the Confidence Bounds Setup window, which allows you to specify the type of confidence bounds you would like to show on your plot.
Target Reliability opens the Set Target Reliability window, as shown below. This window allows you to specify whether and how the target reliability will be shown on the plot.
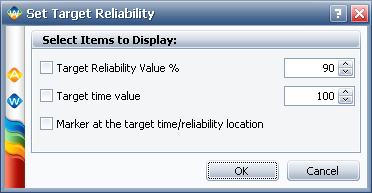
Target Reliability Value, % allows you to enter a reliability value in percent for the target point. If the check box is selected, this value will be displayed on the plot as a horizontal line.
Target time value allows you to enter a time value for the target point. If the check box is selected, this value will be displayed on the plot as a vertical line.
Marker at the target time/reliability location if selected, the target point (the intersection of the target reliability value and the target time value) will be circled on the plot.
Life Lines ![]()
Opens the Specify Life Lines window, which allows you to enter up to 10 unreliability values for each additional life line you would like to see plotted on life vs. stress plots.
Contours Setup ![]()
This option is available only for Contour plots. It opens the Contours Setup window, which allows you to select the contour lines to be shown, the confidence levels represented by the lines and the resolution. If an error in calculating the selected contour lines is encountered, this button will turn red. Use the Contours Setup window to adjust the settings.
This option is available only if the data sheet uses the MLE analysis method. If selected, it adjusts the y-axis plotting positions so that the data points are plotted directly on the MLE line (i.e., at the position where the failure time intersects the MLE line). The solution of the MLE line is obtained from the likelihood function and not from the plotting positions of the points; therefore, this plot setting does not affect the parameter estimates.
Analysis Summary displays calculated results in the Results window. The location of this option varies depending on the folio you are working with.
Set Use Stress ![]()
Opens the Use Stress Level window, which allows you to enter a use stress value for the selected stress type.
Scaling
X and Y Scaling Boxes shows the minimum and maximum values for the x- and y-axes. You can change these values if the check box beside the value range is not selected. If it is selected, the application will automatically choose appropriate values for the range.
Unit IDs is available only for Degradation vs. Time plots in degradation folios. It allows you to select the Unit ID(s) to be shown on the plot. To refresh the plot to show the currently selected ID(s), click the Redraw Plot icon.
Select All selects all the Unit ID(s) to be placed on the plot.
Clear All clears all selected Unit ID(s).
The folio tools are arranged on the left side of the control panel:
![]() Redraw
Plot updates the plot to reflect any changes that have been made.
Redraw
Plot updates the plot to reflect any changes that have been made.
![]() Plot Setup opens the
Plot Setup window, which allows you to customize
most aspects of the plot including the titles, line styles and point styles.
Plot Setup opens the
Plot Setup window, which allows you to customize
most aspects of the plot including the titles, line styles and point styles.
![]() RS Draw launches ReliaSoft Draw, which allows you to
annotate your plot and view your plot in greater detail.
RS Draw launches ReliaSoft Draw, which allows you to
annotate your plot and view your plot in greater detail.
![]() Side-by-Side Plots adds a side-by-side plot to the project, which allows you to view different plots in a single window, and associates the current folio and data sheet with the side-by-side plot. If no side-by-side plots exist in the project, selecting this option creates one. Otherwise, a window will appear which allows you to select an existing side-by-side plot to associate the data sheet with or to create a new one.
Side-by-Side Plots adds a side-by-side plot to the project, which allows you to view different plots in a single window, and associates the current folio and data sheet with the side-by-side plot. If no side-by-side plots exist in the project, selecting this option creates one. Otherwise, a window will appear which allows you to select an existing side-by-side plot to associate the data sheet with or to create a new one.
![]() QCP opens the Quick Calculation Pad (QCP), which allows you to obtain reliability results based on the currently active folio.
QCP opens the Quick Calculation Pad (QCP), which allows you to obtain reliability results based on the currently active folio.
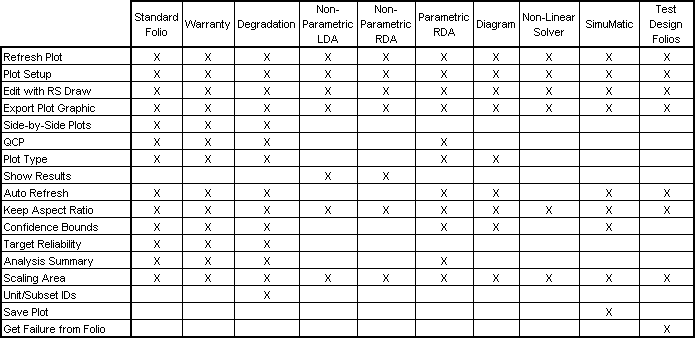
The following table displays the available Weibull++ plot sheet control panel options for each folio or tool.
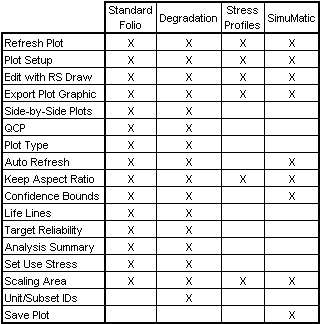
The following table displays the available ALTA plot sheet control panel options for each folio or tool.
© 1992-2015. ReliaSoft Corporation. ALL RIGHTS RESERVED.