![]()
![]()
| Related Topics: | ||
Overlay plots give you the ability to display results from multiple data sheets in a single plot. This allows you to easily compare different data sets, analysis methods or distributions. For example, you may wish to show the reliability plots of two product designs in the same plot or compare a simulation-based data set with actual data obtained from fielded products.
You can compare any data set from Weibull++ and ALTA standard folios, warranty folios and degradation folios. Note that you can add data sets from parametric RDA folios to an overlay plot but you can compare them only with other parametric RDA data sets. You can select up to a maximum of 20 data sheets to add to the same plot.
Before using an overlay plot, you must first calculate the parameters of the data sets. Once that is completed, you can add an overlay plot to either the project or the folio:
To add an overlay plot to a project, choose Insert > Reports and Plots > Overlay Plot.
![]()
All the calculated data sheets in the project will be available for inclusion in the overlay plot.
To add an overlay plot to a Weibull++ or ALTA standard folio, choose [Life Data/ALTA] > Folio Sheets > Insert Additional Plot.
![]()
Only the calculated data sheets in the current folio will be available for inclusion in the overlay plot.
What’s Changed? In previous versions of the software, overlay plots were known as MultiPlots.
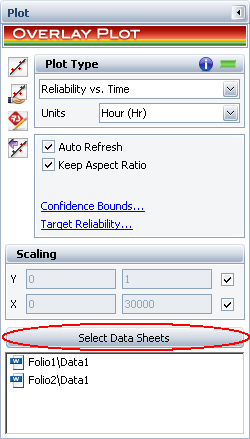
The control panel in an overlay plot is similar to the control panel in standard plots, except for two things:
The Select Data Sheets button gives you the ability to add or remove data sets from the plot.
Probability plots, contour plots and ALTA stress plots are available only if the data sets have been calculated with the same distribution. This is because the scales or axes in those types of plots vary for different types of distributions.
© 1992-2015. ReliaSoft Corporation. ALL RIGHTS RESERVED.