![]()
![]()
| Related Topics: | ||
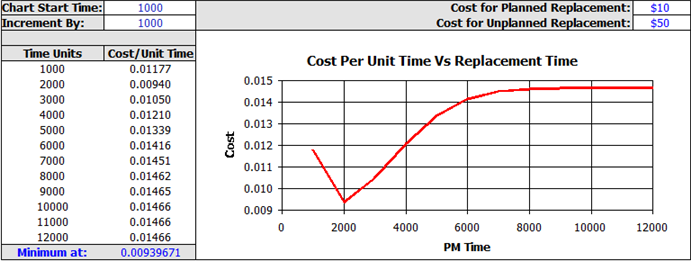
Charts often make it easier to understand large quantities of data and the relationship between different series of data. You can use the Chart Wizard and Chart Designer tools to insert and customize charts in spreadsheet utilities (e.g., analysis workbooks and general spreadsheets). These charts can be placed anywhere in the spreadsheet, and are dynamic (automatically update when the data used to create the chart is changed). In the example below, the report contains an X Y (scatter) plot showing the best time for preventive maintenance.
Note: Some of the links in this topic open a separate help file called Chart Help. If you do not currently have Internet access, these links will not work, but you can browse to the local copy of the help file by opening the Help\ChartDesigner\vcfi5.htm file in your Synthesis application directory.
To insert a chart, such as a bar graph or XY (scatter) plot, you will use the Chart Wizard.
Select the cells that contain the data of interest and choose Sheet > Sheet Actions > Chart Wizard to activate the Chart Wizard.

In the worksheet, click inside the worksheet and drag to select the area where you want to insert the chart.
In the Gallery window, select a chart type (see Chart Types for information on the available charts). Click Next and follow the wizard to add chart and axis titles.
Click Finish to insert the report.
See Analysis Workbook Example for an example of a bar chart being added to a reliability report.
Both the Chart Wizard and Chart Designer can be used to modify an existing chart. The Chart Wizard allows you to change only high level settings (e.g., chart type and titles). The Chart Designer allows you to change the high level settings as well as specific settings (e.g., axis label fonts, location of the legend and series labels). To open either one, double-click inside the chart to select it, then right-click to open the Format Chart shortcut menu.
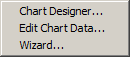
Choose Wizard on the shortcut menu.
In the Gallery window, you can change the chart type, if desired. Click Next and follow the wizard to modify chart and/or axis titles.
Click Finish to update the chart.
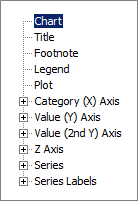
Choose Chart Designer on the shortcut menu.
Use the Element Tree, located on the left side of the window, to select the setting you want to modify. If you are making more than one change, you can click Apply to apply changes while keeping the Chart Designer window open.
Click OK when done.
© 1992-2015. ReliaSoft Corporation. ALL RIGHTS RESERVED.