![]()
![]()
| Related Topics: | ||
The analysis workbook’s control panel provides the following options. (These pictures are from Weibull++. Similar functionality is available in ALTA, RGA and BlockSim.)
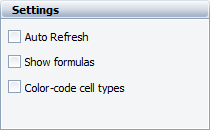
Auto recalculate automatically recalculates formulas when relevant values change in any of the referenced recalculated data sources. This option is also available from the Calculation Options window (Sheet > Format and View > More Settings > Calculation Options).
In BlockSim, it takes more time to recalculate the formulas. Therefore, the automatic option is not available in the control panel. We recommend to manually click the Recalculate icon only if you need it.
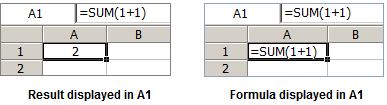
Show formulas displays the formulas instead of the calculated results in the worksheet cells. This option is also available from the Sheet Options window (Sheet > Format and View > More Settings > Sheet Options).
Color-code cell types displays color-coded borders around the cells. This option is also available from the Sheet Options window.
Red: the cell contains a formula
Green: the cell contains a value (i.e., number or text)
Blue: the cell is blank but formatted
No color: the cell is blank and unformatted
The Associated Data Sources area displays the list of up to four data sources that are currently associated with the analysis workbook.
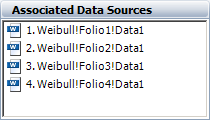
To open a folio or diagram, click the name.
To change one or more of the data sources, click the Associate Data Sources icon.
![]()
To learn more, see Associated Data Sources.
Tip: If you use default data source references in your functions (instead of named data sheets or diagrams), you can quickly display the results from different analyses simply by changing the associated data sources.
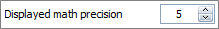
The Displayed math precision area is available for Weibull++/ALTA and RGA. It sets the number of decimal places shown in values returned from functions using a data source (up to 15 digits, as limited by Windows). By default, this will be the same as your preference in the Application Setup. If you make a change, it will be saved with the current report, but will not change the Application Setup or any other reports.
If the report already contains formulas, the new setting will not take effect until you force a recalculation of all formulas by choosing Sheet > Format and View > More Settings > Recalculate Formulas or click the Recalculate icon.
![]()
Note that if you apply a custom number format to the cell (e.g., 0, 0.00, #,##0, etc.), the selected format has priority over the precision setting.
The folio tools are arranged on the left side of the control panel:
![]() Function Wizard opens
the Function Wizard, which helps you
to build functions in analysis workbooks. These functions can return results
ranging from mathematical values (e.g., sine, pi or averages) to reliability
metrics based on associated data sheets (e.g., reliability, probability
of failure, expected number of failures, etc.).
Function Wizard opens
the Function Wizard, which helps you
to build functions in analysis workbooks. These functions can return results
ranging from mathematical values (e.g., sine, pi or averages) to reliability
metrics based on associated data sheets (e.g., reliability, probability
of failure, expected number of failures, etc.).
![]() Spreadsheet View and
Spreadsheet View and
![]() Report View allow
you to toggle between the two views. The spreadsheet view displays the
grid and the column/row headings, while the report view hides them and
displays the analysis workbook in the format in which it will be printed.
Report View allow
you to toggle between the two views. The spreadsheet view displays the
grid and the column/row headings, while the report view hides them and
displays the analysis workbook in the format in which it will be printed.
![]() Recalculate recalculates
formulas when relevant values change in any of the referenced recalculated
data sources.
Recalculate recalculates
formulas when relevant values change in any of the referenced recalculated
data sources.
![]() Defined Names opens
the Defined Names window, which allows
you to create and manage variable names that can be referenced in any
function. You can define a name for any spreadsheet cell or data source.
Defined Names opens
the Defined Names window, which allows
you to create and manage variable names that can be referenced in any
function. You can define a name for any spreadsheet cell or data source.
![]() Associate Data Sources
allows you to define or change up to four default data sources that can
be referenced by functions in this analysis workbook.
Associate Data Sources
allows you to define or change up to four default data sources that can
be referenced by functions in this analysis workbook.
© 1992-2015. ReliaSoft Corporation. ALL RIGHTS RESERVED.