
You can use the Filter Editor to incorporate filters into dashboard items that contain dimension data. Arguments and series are forms of dimension data.
This type of filtering only applies to the dashboard item you have selected. To filter the data across the entire dashboard, see Configuring a Master Filter.
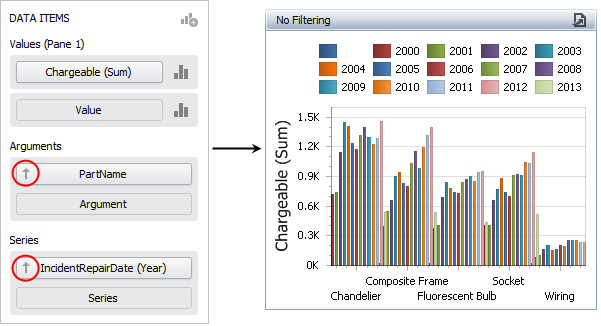
Dimension data can be used in any or all of the following areas:
Dimension bar in the HIDDEN DATA ITEMS panel.
Dimension, argument and/or series bars in the DATA ITEMS panel.
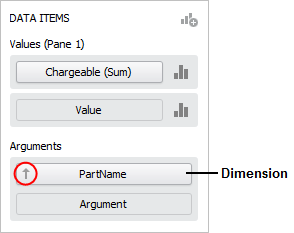
An easy way to determine if a data field is a dimension, argument or series, is to look for the sort arrow to the left of the data field name.
In the Dashboard Layout Designer widow, select a dashboard item, then choose Data > Filtering > Edit Filter. This command is also available in the shortcut menu when you right-click the dashboard item.
![]()
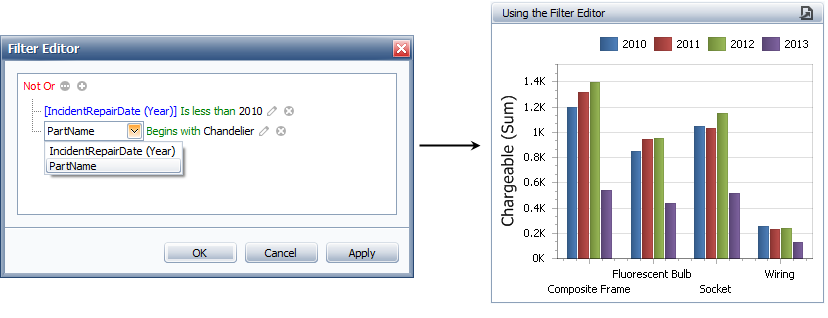
In the Filter Editor window, define the criteria. The dashboard uses the same Edit Filter functionality that is built in to other Synthesis utilities (e.g., Resource Manager, Synthesis Explorer, etc.). (See Finding and Filtering Records.)
In the following example, a chart was created for data that was extracted from XFRACAS into the Synthesis Data Warehouse (SDW) in Weibull++.
Because we are interested in only the chandelier parts (not the whole unit) and data from 2010 and later, we can apply the following filter to remove the unwanted data:
© 1992-2016. ReliaSoft Corporation. ALL RIGHTS RESERVED.
 |
E-mail Link |