
| Related Topics: | ||
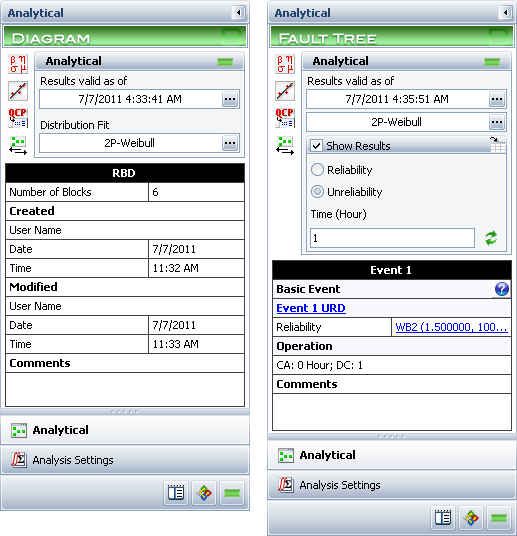
The Analytical page of the control panel for analytical diagrams consists of the following sections:
The Analytical area displays the status and results of the analysis.
The Information area displays information about the diagram or the currently selected block. If no block is selected in the diagram, the Information area displays the number of blocks in the diagram and information about the diagram creation and last modification; in addition, if the diagram results have been published as a model, the name of the model will appear as a link allowing you to view the model in the Synthesis Viewer window. If a block is selected in the diagram, it displays a subset of the properties found in the Block Properties window. Items in the table that are resources (e.g., models, switches, etc.) are links; you can click such items to view and/or edit their properties. In both cases, this area also offers a Comments field; click the field heading to enter comments. For blocks, these comments are also accessible in the Identifiers properties in the Block Properties window.
The Tools area gives you quick access to the tools you will need to analyze the diagram and generate additional results. To view descriptions of these icons, click them in the picture below.

Tip: There is a horizontal splitter bar directly above the Analytical button. If you drag it as far up as it will go, all of the pages of the panel will be accessed by large buttons. If you drag it all the way down, all of the pages will be accessed by small icons. Positions in between allow you to use some large buttons and some small icons. See Control Panels.
The Analytical area of the control panel displays the status and results of the analysis.
Status If the light is green, then the diagram has been analyzed. If the light is red, then the diagram has not been analyzed. An analyzed diagram will remain in the analyzed state unless a change is made to the structure of the diagram (e.g., a block is added, a connector is removed, etc.). Changes that do not affect the reliability-wise configuration of the diagram (e.g., changing the model used by a block in a diagram that is not using identical block simplification) will not necessitate reanalysis.
Show Algebraic Solution (...) displays the algebraic solution for the diagram in the Equation Viewer.
Distribution fit displays the distribution that has been fitted to the analytical results. Click the button (...) to open the Distribution Estimator to fit a distribution and/or for information on the fitted distribution parameters. The fitted distribution can be used to describe the overall behavior of the system and can be published for use as a model elsewhere in the project.
Show Results if selected, results at the event or gate level will be displayed at the upper right of each block in the diagram. This option is available only for fault trees. Select to display the results as reliability or unreliability values and specify the time at which the results should be calculated. The units for the time are the default units, as specified in the Units window. Click the Update icon to update the results shown in the diagram without reanalyzing the diagram.
![]()
You can click the Spreadsheet View icon to view the results for all gates and events in a spreadsheet-style report in the Results window.
![]()
© 1992-2013. ReliaSoft Corporation. ALL RIGHTS RESERVED.