
| Related Topics: | ||
Use the Report Builder to design the reports and charts that will be available in the Reports page and the Charts page. You can save reports that are visible only to you or shared with a specific user or group. If you have the required permissions, you can also modify the built-in "Standard" reports or save new "Public" reports that are visible to all users in the entity.
To access the page, choose Options > Designers > Report Builder.
![]()
Use the Select Report drop-down lists to select a report/chart to create or modify. For example:
To create a new report, select an existing one that is similar. Apply your changes and click Save As. You will be prompted to specify the name, description and other details. (See Save Report Window.)
To modify a report that already exists, select that report. Apply your changes and click Save (or Save As if you also want to be prompted to change the name, description or other details.)
To preview the results, save the report and then choose Options > Report > Generate.
![]()
For predefined report types (Standard Reports, Chart Reports, Administrator
Reports), you can click ![]() to reload the last saved
settings. If the saved settings differ from the default for that type
of report, you can also click
to reload the last saved
settings. If the saved settings differ from the default for that type
of report, you can also click ![]() to restore the application defaults.
to restore the application defaults.

What's changed? Starting in Version 2019, the default Standard and Chart Reports can be modified by users with the "Report Builder - Set Application Default" permission.
For reports that were created by users (My Reports, My Chart Reports,
Public Reports, Public Chart Reports, Custom SQL Statements), you can
click ![]() to reload the last saved settings or
to reload the last saved settings or ![]() to delete the report.
to delete the report.

The table contains a row for each field that will be displayed in the results and/or used as a filter.
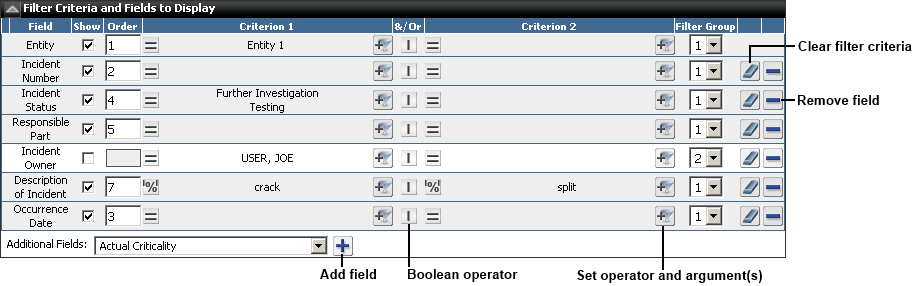
To add a field, choose it from the Additional
Fields drop-down list and click Add
Field ![]() .
.
Note: The maximum number of columns that a report can include is determined by an application admin.
To remove a field, click the Remove
Field icon, ![]() , in that row.
, in that row.
When building a report, use the check box in the Show column to show or hide the field in the results. If the field is shown, enter a value in the Order column to specify the location of the column in the results. Numbers that are skipped are ignored.
In the Criterion columns,
click Add Filter Criteria,
![]() , to specify the operator and argument(s) for
each field. (Alternatively, you can click the operator icon on the
left to open the same window.) If more than one criterion is specified
for the same field, click inside the &/Or
column to toggle between AND (
, to specify the operator and argument(s) for
each field. (Alternatively, you can click the operator icon on the
left to open the same window.) If more than one criterion is specified
for the same field, click inside the &/Or
column to toggle between AND (![]() )
and OR (
)
and OR (![]() ).To clear all filter criteria for a
field, click Clear Values,
).To clear all filter criteria for a
field, click Clear Values,
![]() .
.
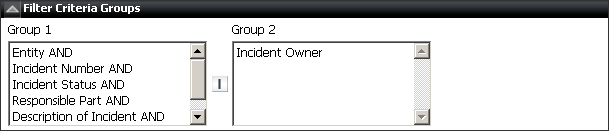
To apply the criteria in groups (e.g., results can match criteria 1 and 2 OR criteria 3 and 4), use the Filter Group column to define the groups then use the Filter Groups Criteria section to define the operator that will be applied between groups (as described below).
When applicable, report results can include information about the particular template part or serialized system that each incident or problem pertains to:
For incidents, the report can include fields from the System/Component Information Area as well as any configurable fields for the template part or serialized system.
For problems, the report can include the "Part Category" as well as any configurable fields for the specified part.
In the Report Builder's Additional Fields list, these fields are identified with the prefix "Part Detail" (for template parts) or "Serialized Detail" (for serialized systems).
A Print Preview field is a link to a customized presentation of the data for a particular record. If an administrator has configured this type of field in the page for a given record type, you can include those links in your report. The report results will show the same link that is displayed in the record. Since every record will have the same link, the criterion columns will not be available for this type of field.
If you have specified more than one Filter
Group in the table, you can toggle between AND (![]() )
and OR (
)
and OR (![]() ) to specify the operator that will be applied
between groups.
) to specify the operator that will be applied
between groups.
In the following example, the results will include records that match all of the criteria in the first group (AND operators for all fields in Group 1) or the single criterion in the second group (OR operator between Groups 1 and 2).
When you are building a report, this area specifies how the results will be sorted when they are generated. The results will be sorted by each field in the Selected list, successively.
Select a field and click ![]() or
or
![]() to move it from one list to the other. Double-click a field in the Selected
list to toggle between ascending (ASC) and descending (DESC) order.
to move it from one list to the other. Double-click a field in the Selected
list to toggle between ascending (ASC) and descending (DESC) order.
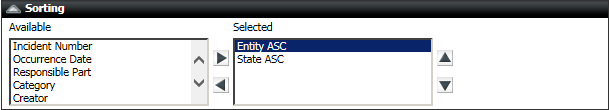
Users can also change the sort order after the report is generated. (See Reports.)
When you are building a report, this area determines whether the results will be displayed in HTML or XSLT.
HTML - the results will be displayed in a tabular format and you can specify the number of records shown per page.
XSLT - you can specify the *.xslt style sheet (Extensible Stylesheet Language Transformation) that will be used to customize the presentation of the results.
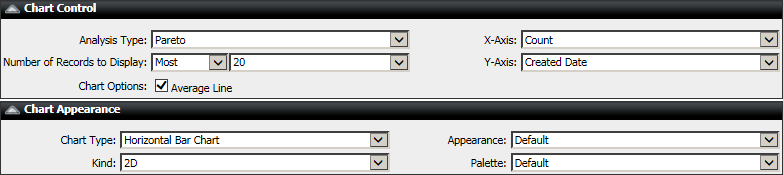
When you are building a chart, these areas specify how the data will be presented.
Analysis Type - you can select Pareto (e.g., bar chart, pie chart, scatter chart, etc.) or Trend Analysis (e.g. line chart).
X-Axis and Y-Axis specify the data displayed in the chart. This is always a count of the number of records that have the same value for the field selected as the Y-axis (e.g., incidents by responsible part, actions by type, etc.).
Tip:
The Y-Axis list excludes some types of fields that are not
relevant for this type of chart (e.g., descriptions, check boxes, accessories,
companies, trees, part details, etc.).
In addition, it is not recommended to select fields that show counts obtained
from the query (e.g., Action Count, Status Count, Chargeable Incident
Count, etc.). In such cases, the chart will show a separate bar or slice
for each record and increment any duplicate counts (e.g., 2, 2 [1], 2[2],
etc.).
Number of Records to Display
For pareto analyses, you can display the records that either have the most number of matches to the criteria or the least number of matches to the criteria.
For trend analyses, you can display the records that either have the most recent dates that match the criteria or the oldest dates that match the criteria.
Chart Options
For pareto analyses, you can show the Average Line.
For trend analyses, you can show the Average Line or the Trend Line. The Trend Line shows a smoothed-out curve that follows the data. This an Exponentially Weighted Moving Average (EWMA) line, which is calculated using a cubic B-spline (CBS) process to smooth out the line, with a correction factor of 0.5.
The appearance settings specified here will be applied when the chart is first generated. Users can also change these options after the chart is generated. (See Charts.)
Chart Type - for Pareto analysis, select bar, line, area, step, pie or scatter. Trend charts can only display as a line chart.
Kind - 2-dimensional or 3-dimensional
Appearance - the background color scheme
Palette - the colors used for chart elements
In the following example, these settings will generate a horizontal bar chart that shows the 20 dates on which the greatest number of incidents were created along with a line showing the average number of incidents created daily.
When applicable, you can use the Save Report window to enter or change the Report Name, Report Description and Report Icon.
Depending on your permissions, you may also be able to select:
Save report for another user or Save report for a security group - makes the report available to a selected user or to all users in a selected security group. Only the specified user(s) will be able to view and edit the report, and it will show under "My Reports" or "My Charts."
Tip: If you create a report for another user, or for a security group that you don't belong to, you will not be able to access it again after the save. If you need to be able to edit the report again in the future, it is recommended to make sure you belong to the security group or save your own personal copy that you can modify and share again if needed.
Save as application default - saves the current settings as the application default for this type of report, replacing the prior default. You cannot undo this action.
Make Public - makes the report available to all users in the current entity. Any user in the entity will be able to view and edit the report, and it will show under "Public Reports" or "Public Chart Reports."
Add SDW Data Source - makes the report available to the Synthesis Data Warehouse (SDW) in Weibull++, ALTA or RGA.
You can then use the SDW to create custom dashboards for the data that will be visible in ReliaSoft desktop applications or the Synthesis Enterprise Portal (SEP). (See "Connect to XFRACAS Report" in the Weibull++/ALTA or RGA documentation.)
Within XFRACAS, these reports are not visible in the Reports page, but they can be accessed for subsequent editing under "SDW Data Sources" in the Report Builder.
© 1992–2019. HBM Prenscia Inc. ALL RIGHTS RESERVED.
| E-mail Link |