
| Related Topics: | ||
To access XFRACAS chart reports, choose Home > View > Charts.
![]()
![]() Watched Charts
include charts of any type (standard, public, etc.) that you have selected
to "watch." (See Watched
Reports and Charts.).
Watched Charts
include charts of any type (standard, public, etc.) that you have selected
to "watch." (See Watched
Reports and Charts.).
![]() Chart Reports are included by default with XFRACAS.
Chart Reports are included by default with XFRACAS.
![]() My Chart Reports have been customized and saved via
the Report Builder for your personal
use. This may include reports that you saved for yourself or reports that
another user saved for you personally or a security group that you belong
to.
My Chart Reports have been customized and saved via
the Report Builder for your personal
use. This may include reports that you saved for yourself or reports that
another user saved for you personally or a security group that you belong
to.
![]() Public Chart Reports have been customized and saved
via the Report Builder for all users to view.
Public Chart Reports have been customized and saved
via the Report Builder for all users to view.
When you view a chart:
![]() Report Builder opens the
Report Builder where you can define a
new chart.
Report Builder opens the
Report Builder where you can define a
new chart.
![]() Data Table displays a tabular
report of the data.
Data Table displays a tabular
report of the data.
![]() Export sends the current
chart to the file format specified in the drop-down list (*.xls, *.xlsx,
*.png, *.jpeg, *.bmp, *.tiff or *.gif).
Export sends the current
chart to the file format specified in the drop-down list (*.xls, *.xlsx,
*.png, *.jpeg, *.bmp, *.tiff or *.gif).
![]() Watch adds the chart to
the Watched Charts group.
Watch adds the chart to
the Watched Charts group.
![]() Refresh reloads the last saved
settings.
Refresh reloads the last saved
settings.
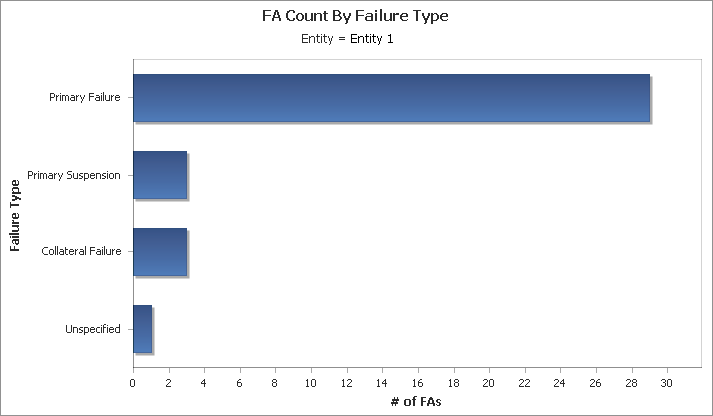
To drill down in the chart, simply double-click the bar, slice or point of interest. In the Chart Drilldown window, then select the qualifier to be used for drilldown. You can then choose to generate a chart, a trend analysis or a report based on the qualifier. For example, the pareto chart shown next displays a count of failure analysis reports broken down by failure type.
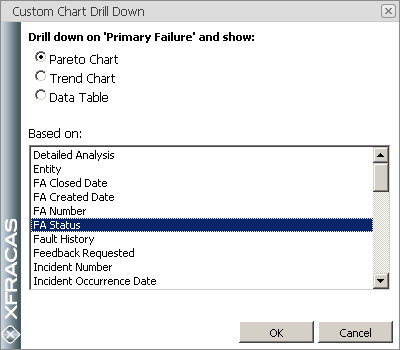
Double-clicking the Primary Failure bar opens the Custom Chart Drill Down utility.
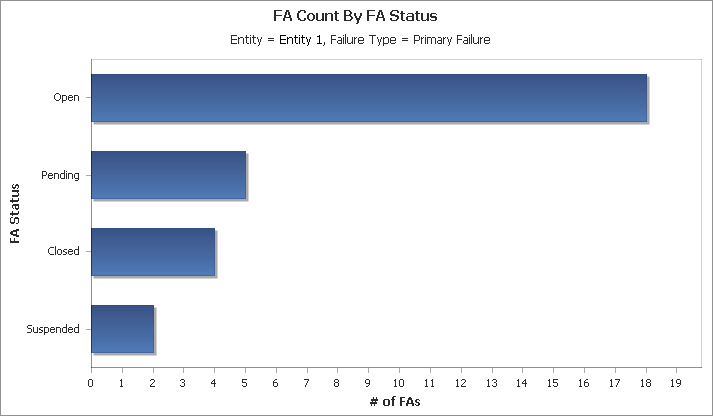
Selecting an option opens a chart in an new window, such as the pareto chart shown next, that displays the number of FAs pertaining to the primary failures that are in each status,
© 2006-2017. HBM Prenscia Inc. ALL RIGHTS RESERVED.