![]()
![]()
The following information is provided in the analysis results for Taguchi OA designs with standard response data.
The following table provides general information about the effects of the factors and factorial interactions on the selected response. This information may be presented for individual factors and interactions or for groups of factors and interactions, depending on your analysis setting on the control panel.
The following table provides specific information on the contribution of each factor or factorial interaction to the variation in the response and an analysis of the significance of this contribution.
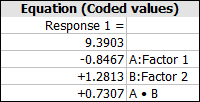
Note: For each factor with n levels, n-1 effects are estimated (e.g., one effect is estimated for a two level factor, four effects are estimated for a five level factor). For a two level factor, the effect is the difference of the average response at the two levels. For factors with more levels, the average response at one level is considered to be a baseline and the average responses at other levels are compared with that baseline. If more than one effect exists for a factor, the effects are differentiated with a number along with the factor’s letter designation (e.g., A[1], A[2]).
Other tables include:
All of the following tables provide information that was generated from the main calculations. The available tables will vary depending on the design type you are working with. The results that could be available include:
© 1992-2017. HBM Prenscia Inc. ALL RIGHTS RESERVED.
 |
E-mail Link |

 ANOVA Table