![]()
![]()
The Analysis Summary window allows you to display a detailed summary of current and past analysis results. This window is available from any of the following folios:
The standard, robust or mixture design folios
The free form folio
All of the measurement system analysis folios
To access the window, click the View Analysis Summary icon.
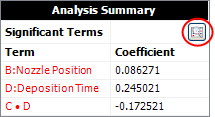
In addition to a spreadsheet that displays analysis information, the window includes two panels and a ribbon, as described next.
The Available Report Items panel is used to determine which analysis results will display in the spreadsheet. The items you see in this panel will vary depending on the design type and/or folio that you are working with. If desired, you can edit the results anywhere in the spreadsheet by clicking a cell. These changes can then be copied to the Windows Clipboard or exported to an Excel spreadsheet using the ribbon.
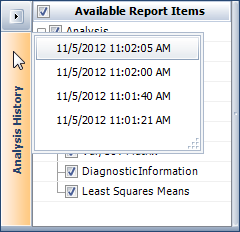
The Analysis History panel includes a history of all the results for all analyses that have been performed in the folio. To display the results of a prior analysis, click the date and time of that analysis in the list.
You can switch between the panel's hidden and displayed states by clicking the Hide/Show icon in its title bar.

When the panel is in its hidden state, a bar containing the analysis history will be displayed on the left side of the window, and the list of results will be hidden until you click the bar, as shown next. To hide the results again, click outside the list.
The ribbon of the Analysis Summary window allows you to cut, copy, paste and print the displayed analysis results, as well as save them in an Excel spreadsheet.
If you choose Settings > Apply Settings from the ribbon, the analysis settings that were used to obtain the displayed results will be applied to the current analysis. For example, if you used the Analysis History panel to view results that were obtained using a risk level of 0.5, and if you wanted to use that risk level and all the other settings from that prior analysis, you would choose this command and then recalculate the folio.
Note that you can apply the settings from a prior analysis only if it is based on the same design and response data as the current analysis. If this isn't the case for the displayed analysis results, then the results will include red text that says, "The design has been modified since this history was created. These settings can no longer be applied to this response."
© 1992-2017. HBM Prenscia Inc. ALL RIGHTS RESERVED.
 |
E-mail Link |