![]()
![]()
The data set used in this example is available in the example database installed with the software (called "DOE11_examples.rsgz11"). To access this database file, choose File > Help, click Open Examples Folder, then browse for the file in the DOE sub-folder.
The name of the example project is "One Factor - Operators in Pulp Mill."
Consider the following experiment, which was performed at a pulp mill. Plant performance is based on pulp brightness, as measured by a reflectance meter. Each of the four shift operators (denoted by A, B, C and D) made five pulp handsheets from unbleached pulp. Reflectance was read for each of the handsheets using a brightness tester. The data set is shown next.
Operator A |
Operator B |
Operator C |
Operator D |
59.88 |
59.87 |
60.83 |
61.01 |
60.12 |
60.32 |
60.87 |
60.87 |
60.88 |
60.42 |
60.56 |
60.69 |
60.98 |
59.99 |
61 |
60.53 |
59.9 |
60.12 |
60.5 |
60.63 |
A goal of the experiment is to determine whether there are significant differences between the operators in making the handsheets and reading their brightness. If there are such differences, then the operators may not be creating the handsheets or recording their observations in a consistent manner.
To determine whether there are differences between the operators, the experimenters create a one factor design folio and enter the response values into the folio for analysis. The design matrix and the response data are given in the "Operator Study" folio. The following steps describe how to create this folio on your own.
Choose Insert > Designs > Standard Design to add a standard design folio to the current project.
Click Design Type in the folio's navigation panel, and then select One Factor in the input panel.

Rename the response by clicking Response 1 in the navigation panel and entering Reflectance in the input panel.
Define the factor by clicking Factor 1 in the navigation panel and editing its properties in the input panel.
Factor name: Operator
Factor type: Qualitative
Number of levels: 4
Level 1: Operator A
Level 2: Operator B
Level 3: Operator C
Level 4: Operator D
Rename the folio by clicking the Experiment1 heading in the navigation panel and entering Operator Study for the Name in the input panel.
Click the Additional Settings heading. In the input panel, set the number of Replicates to 5 (since there are 5 measurements from each operator).
Finally, click the Build icon on the control panel to create a Data tab that allows you to view the test plan and enter response data.
![]()
The data set for this example is given in the "Operator Study" folio of the example project. After you enter the data from the example folio, you can perform the analysis by doing the following:
Note: To minimize the effect of unknown nuisance factors, the run order is randomly generated when you create the design. Therefore, if you followed these steps to create your own folio, the order of runs on the Data tab may be different from that of the folio in the example file. This can lead to different results. To ensure that you get the very same results described next, show the Standard Order column in your folio, then click a cell in that column and choose Sheet > Sheet Actions > Sort > Sort Ascending. This will make the order of runs in your folio the same as that of the example file. Then copy the response data from the example file and paste it into the Data tab of your folio.
Click the Calculate icon on the Data tab control panel.
![]()
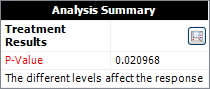
The result in the Analysis Summary area show that the p value is 0.0210. In other words, there is a 2.1% chance that the variation would be observed in the case when there is no significant difference between the response levels. Since the p value is less than the risk level (10%) entered on the Analysis Settings tab of the control panel, the conclusion is that the different factor levels (i.e., operators) do affect the response.
To see more detailed comparisons of the responses at different factor levels, click the View Analysis Summary icon and view the Mean Comparisons table.
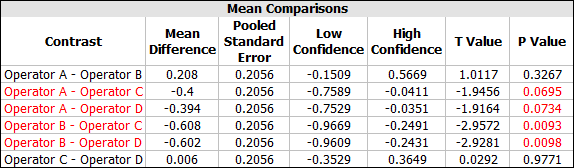
The compared factor levels are listed in the Contrast column (e.g., "Operator A - Operator B" is the comparison of those two operators). When a p value is red, the compared levels are significantly different. For example, there is a significant difference between Operator A and Operator C, but there is no significant difference between Operator A and Operator B.
To see a plot that also allows you to compare the different factor levels, click the Plot icon.
![]()
Then view the box plot. In this plot, you can see that see that operators C and D are nearly the same.
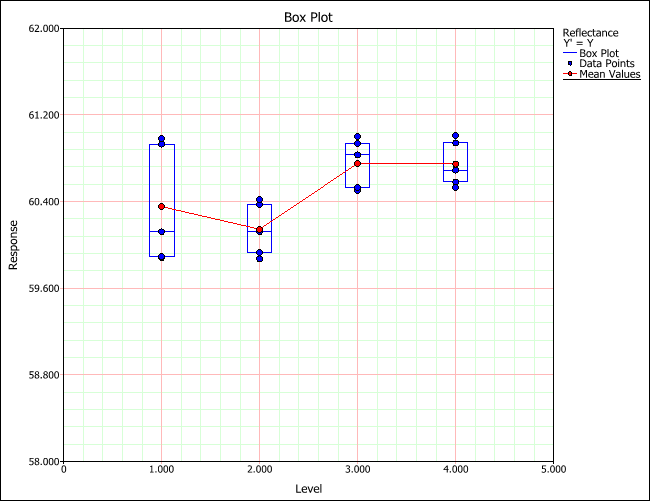
The results show that there is a significant difference between operators A and C, between A and D, and so forth. As a result, the operators receive further training to insure that they create the handsheets and record their observations consistently.
© 1992-2017. HBM Prenscia Inc. ALL RIGHTS RESERVED.
 |
E-mail Link |