![]()
![]()
![]()
Now in Version 10, you can analyze data obtained from degradation tests where only one measurement is taken per test unit. This is typical of destructive degradation tests, where the process of measuring a test unit also destroys it.
Unlike the Weibull++ degradation analysis folio, which extrapolates failure times for each test unit and then performs life data analysis on the extrapolated times, the destructive degradation analysis folio fits the degradation measurements directly to the chosen degradation model and life distribution, and then uses the result to predict future failure behavior. Because failure times are not extrapolated, the analysis does not require multiple measurements per test unit.
This topic discusses the following:
To add a destructive degradation analysis folio to an existing project choose Insert > Folios > Destructive Degradation Folio or right-click the Specialized Folios folder in the current project explorer and choose Add Destructive Degradation on the shortcut menu.
![]()
The following example shows a destructive degradation analysis.
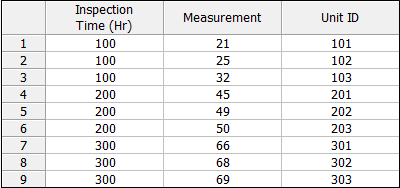
The data sheet contains the following information:
The Inspection Time column indicates the time at which the degradation of the unit was measured. Time may also be measured as the amount of usage the sample accumulates or as the factor that degrades the unit.
The Degradation column indicates the degradation measurement of a unit.
The Unit ID column indicates the unit being measured, which in this case is also the unit that was destroyed. The IDs are optional and do not affect the calculations, but when provided they will be used to color-code data points in plots.
The destructive degradation folio control panel allows you to configure the analysis settings for the data sheet and view/access the results. It consists of multiple pages, each containing options for performing particular tasks. This topic focuses on the Main page of the destructive degradation folio control panel, which contains the tools you will need to analyze the data set. For more information about control panels in general, see Control Panels.
The Main page includes the following settings:
The Degradation Model area allows you select the mathematical model that best describes the product's degradation over time. The following is a list of all available models and their corresponding equations. The function L(t) is the relationship between time and the location parameter of the measurement distribution, the variable t represents the time, and the variables a and b are the model parameters to be solved for in the calculation.
Linear: L(t) = a*t + b
Exponential: L(t) = b * exp(a*t)
Power: L(t) = b * (t^a)
Logarithmic: L(t) = a*ln(t) + b
Lloyd-Lipow: L(t) = a - b/t
Tip: If you are not certain which degradation model would provide the best fit for your data, you can use the Degradation Model Wizard to guide you through the selection process.
The Critical Degradation field is for defining the level of degradation that is considered a failure. For example, you might wish to define failure as the time when the depth of the tire tread is less than 2 millimeters.
The Measurement Distribution area lets you choose the distribution that describes the degradation measurements obtained at any given time. "MLE" and "FM" are displayed underneath the distribution to indicate that the maximum likelihood estimation (MLE) method will be used to estimate the distribution's parameters, and the Fisher matrix (FM) method will be used to solve for the confidence bounds.
When you click the Calculate icon on the control panel, the software calculates the scale parameter of the measurement distribution along with the parameters of the selected model, which represents the effect of time on the distribution’s location parameter, using the given data points
The Analysis Summary area displays the calculated parameter values and other values for the estimated measurement distribution. You can click anywhere within the Analysis Summary area to open the Results window, which displays the calculated results in a worksheet. From the Results window, you can edit, copy or print the results.
The folio tools are arranged on the left side of the Main page of the control panel. Use these tools to manage data and experiment with the results of your analysis.
![]() Calculate estimates
the parameters of the chosen model, based on the current data set and
the specified analysis settings. This tool is also available by choosing
Degradation > Analysis > Calculate.
Calculate estimates
the parameters of the chosen model, based on the current data set and
the specified analysis settings. This tool is also available by choosing
Degradation > Analysis > Calculate.
![]() Plot
creates a new sheet in the folio that provides a choice of applicable
plot types. This includes the degradation vs. time plot in addition
to some life data analysis plots.
This tool is also available by choosing Degradation
> Analysis > Plot.
Plot
creates a new sheet in the folio that provides a choice of applicable
plot types. This includes the degradation vs. time plot in addition
to some life data analysis plots.
This tool is also available by choosing Degradation
> Analysis > Plot.
![]() QCP
opens the Weibull++
Quick Calculation Pad, which allows you to calculate life data analysis
metrics, identical to the calculations you can perform in a Weibull++
standard folio. This tool is also available by choosing Degradation
> Analysis > QCP.
QCP
opens the Weibull++
Quick Calculation Pad, which allows you to calculate life data analysis
metrics, identical to the calculations you can perform in a Weibull++
standard folio. This tool is also available by choosing Degradation
> Analysis > QCP.
![]() Degradation Model Wizard
opens the Degradation Model Wizard,
which helps you select the degradation model that best fits your data.
This tool is also available by choosing Degradation
> Analysis > Model Wizard.
Degradation Model Wizard
opens the Degradation Model Wizard,
which helps you select the degradation model that best fits your data.
This tool is also available by choosing Degradation
> Analysis > Model Wizard.
![]() Distribution Wizard
opens the Distribution Wizard,
which helps you select the measurement distribution that best fits the
data set. This tool is also available by choosing Degradation
> Analysis > Distribution Wizard.
Distribution Wizard
opens the Distribution Wizard,
which helps you select the measurement distribution that best fits the
data set. This tool is also available by choosing Degradation
> Analysis > Distribution Wizard.
![]() Change Units opens
the Change Units window, which allows you
to change the units for the time values in the current data sheet.
Change Units opens
the Change Units window, which allows you
to change the units for the time values in the current data sheet.
© 1992-2016. ReliaSoft Corporation. ALL RIGHTS RESERVED.
 |
E-mail Link |