
Growth Planning Folio and Multi-Phase Plot |
||
RGA's growth planning folio helps you to plan a single- or multi-phase reliability growth test program that is designed to achieve a specific MTBF or reliability goal. For the most advanced functionality, this typically uses the Crow Extended growth planning model. Starting in Version 2019, the MIL-HDBK 189 planning model is also available in the Continuous Growth Planning folio, allowing you to compare the results between the two models.
To create a growth planning folio, right-click the Test and Planning folder in the current project explorer and choose either Add Continuous Growth Planning (if working with times-to-failure data) or Add Discrete Growth Planning (if working with one-shot devices).
Important: Starting in Version 2019, when you add a Continuous Growth Planning folio, you need to select the model that you will be using on the control panel. Your choice will determine the required inputs.
In the data sheet of the folio:
Do you know how the test time will be accumulated across each test phase? Choose Yes if you want to specify the end time (and other details) for each phase of testing. Choose No if you want to create a plan for a single test phase with no specific end time.
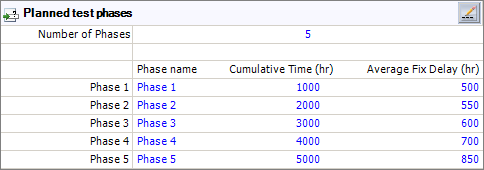
Planned test phases is available at the bottom of the data sheet only if you chose Yes to the question in step 1 above. Specify the number of phases and then define each phase:
Phase Name can be any alphanumeric identifier, up to 50 characters.
Cumulative Time is the amount of cumulative test time at the end of each phase. Because this represents cumulative test time across all test phases, the number must be higher for each subsequent phase.
Average Fix Delay is the amount of test time from when a failure mode is discovered until a fix is likely to be implemented. (Not available when using the MIL-HDBK 189 model.)
As an example, the following picture shows the inputs for a multi-phase test with 5 test phases that last 1,000 hours each. In the first phase, the planners estimate that delayed fixes (for BD failure modes) will, on average, take 500 hours each. The fix time is expected to increase in later phases.
If there are a lot of test phases and/or
if you have this information available in an external data file, you can
click the Edit Phase Data icon
![]() to open a more flexible spreadsheet for entering/editing
these details. The Import icon
to open a more flexible spreadsheet for entering/editing
these details. The Import icon
![]() at the bottom of this window allows you to import
data from an Excel spreadsheet (*.xls or *.xlsx). Note that if you import
from Excel, it will overwrite anything that you may have already entered
(i.e., the data from Excel replaces entries rather than being appended).
at the bottom of this window allows you to import
data from an Excel spreadsheet (*.xls or *.xlsx). Note that if you import
from Excel, it will overwrite anything that you may have already entered
(i.e., the data from Excel replaces entries rather than being appended).
Each growth planning model considers a set of variables; you will select to solve for one of them (i.e., Which value would you like to calculate?) based on your inputs for the rest of them (i.e., Assumed inputs for the reliability growth test plan.)
For the Crow-Extended model, the following variables are considered. (Note that the calculations in the continuous growth planning folio are in terms of MTBF, while the calculations in the discrete growth planning folio are in terms of reliability.)
Initial MTBF/Reliability is the value before the test program begins. It can be determined by some initial testing or through historical information, engineering expertise and/or reliability predictions.
Goal MTBF/Reliability is the requirement that you need to achieve by the end of the test program.
Growth Potential Design Margin estimates the amount by which the growth potential value (i.e., the value that would be achieved if you continued testing until all failure modes are observed and corrected according to the current maintenance strategy) exceeds the goal. This value provides a "safety factor" to ensure that the requirement is met. A higher GP design margin means there's a smaller risk that the reliability observed in the field will not meet the requirement, but it also means a more rigorous reliability growth program will be required. Typically, the GP design margin is between 1.2 and 1.5.
Average EF (where EF = effectiveness factor) estimates the fractional decrease in failure intensity you expect to achieve by implementing design fixes. Typically, about 30% of the failure intensity for the failure modes that are addressed will remain in the system after implementing all of the design fixes; therefore, in many reliability growth programs, the average effectiveness factor is 0.7. The value must be greater than 0, and less than 1.
Management Strategy Ratio determines the percentage of the unique failure modes discovered during the test that will be fixed. This is an important variable in reliability growth planning because the management strategy can be changed to address a larger percentage of the discovered failure modes if the goal cannot be reached with the current strategy. Generally, the management strategy is recommended to be above 90%.
Discovery Beta is the rate at which new, unique B failure modes are being discovered during testing. These are the failure modes that will be fixed. In growth planning, it is assumed that most failures will be identified early on, and that new failure modes will be discovered at a decreasing rate as the test proceeds. Therefore, this value must be greater than 0 and less than 1. This input is always required; you cannot solve for the discovery beta.
Average Fix Delay is used only for single-phase plans with no specific end time (i.e., you chose No to the question in step 1 above). This value is the amount of test time from when a failure mode is discovered until a fix is likely to be implemented. If this value is considered, it is required as an input; you cannot solve for the average fix delay.
For the MIL-HDBK 189 model, the following variables are considered:
Average MTBF over the First Test Phase is the value before the test program begins. It can be determined by some initial testing or through historical information, engineering expertise and/or reliability predictions.
Growth Parameter is how fast the rate is expected to grow.
Final MTBF is the requirement that you need to achieve by the end of the test program.
Test Time for First Phase is used only for single phase plans with no specific end time (i.e., you chose No to the question in step 1 above). This value is the time it will take for the first phase to be completed.
Total Test Time is used only for single phase plans with no specific end time (i.e., you chose No to the question in step 1 above). This value is the total time the test will take.
Once you have entered all of the required inputs, calculate the results by choosing Test and Planning > Analysis > Calculate or clicking the icon in the control panel.
![]()
The result shows the estimated value for the metric you have selected to solve and other results that may be used to evaluate the test plan. You can then use the Plot sheet to visualize the results expected if you implement the test plan, and the QCP to calculate a variety of metrics based on the test plan.
Additional results in continuous growth planning folios when using the Crow Extended model:
Time at which growth begins is the estimated time when the first B failure mode (i.e., the first failure mode that will be fixed) is expected to occur. Reliability growth is expected to begin after this time.
Final MTBF is the expected MTBF at the end of the test, taking into account the average fix delay.
Time to reach goal is the test time at which the goal MTBF is expected to be reached. The Actual value takes into account the average fix delay, and the Nominal value does not. If the current test plan will not meet the goal, this field displays "Goal not met."
Additional results in discrete growth planning folios:
Trial at which growth begins is the estimated number of trials when the first B failure mode (i.e., the first failure mode that will be fixed) is expected to occur. Reliability growth is expected to begin after this time.
Initial MTrBF (where MTrBF = mean trials before failure) is the initial estimated system MTrBF.
Growth Potential MTrBF is the expected MTrBF that could be reached if you continued testing until all B failure modes are observed and fixed according to the management strategy.
Final MTrBF is the expected MTrBF at the end of the test.
Num. trials to reach goal is the number of trials at which the goal reliability is expected to be reached. The Actual value takes into account the average fix delay, and the Nominal value does not. If the current test plan will not meet the goal, this field displays "Goal not met."
© 1992-2019. HBM Prenscia Inc. ALL RIGHTS RESERVED.
| E-mail Link |