
This tile provides at-a-glance metrics for a single FMEA or a combined group of FMEAs. These metrics may include record counts and % analyzed, risk profiles and % reduction in RPN and new risks and actions incurred within a specified time period, among others.
To change the project and/or select different FMEAs, use the Settings dialog box. (See Choose FMEAs to Display.)
To open the FMEA page for the selected project, click the Open Page icon, ![]() .
.
Note: All stats are calculated based on unique records within the given data set. If the same control, action and/or task resource appears multiple times in the selected FMEA(s), each unique record is counted only once. This also applies to records from linked FMEAs. (See Resources and Linked FMEAs in the XFMEA/RCM++/RBI help.)
This stat is a count of the unique failure causes in the selected FMEA(s).

This stat is the percentage of unique failure causes in the selected FMEA(s) that have been "analyzed." A cause is considered analyzed if it meets these conditions:
It can be assigned to a risk priority level.
Values have been assigned to all O and/or D ratings that have been enabled.
All enabled risk metrics (RPN, SxO, SOD and/or SD) have been calculated. (See Interface Styles in the XFMEA/RCM++/RBI documentation.)
If the FMEA structure is “causes before effects,” its effect has been defined and analyzed.
The percentage is calculated by summing all of the failure causes that meet these criteria and then dividing by the sum of all failure causes. (See FMEA Stats (Web Summary) for more information.)
This stat lists the number of unique controls and actions in the selected FMEA(s).
This stat is a simple count of the numbers of each type of record in the selected FMEA(s).
This stat indicates how much the risk priority number (RPN) for all failure causes in the selected FMEAs has decreased. Because the percentage will increase as you mitigate the risks in your design, the % reduction in the total RPN allows you to track the progress and effectiveness of your team's actions.
It will only display if both the initial and revised RPN have been enabled for the project.
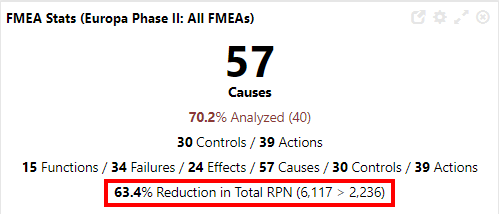
The % reduction in the total RPN is calculated as follows:
(Sum of initial RPNs for all causes – Sum of current RPNs for all causes) / Sum of initial RPNs for all causes
Note: "Current" always represents the most recently calculated metric for the failure cause. If a revised RPN is not calculated, the initial RPN is used to represent the "current" risk.
For example, if your selected FMEA contains three failure causes with the following RPNs, the % reduction would be calculated as follows: (792 – 520) / 792 x 100 = 34.3%
|
|
Initial RPN |
Current RPN |
| Cause 1 | 512 | 240 |
| Cause 2 | 216 | 216 |
| Cause 3 | 64 | 64 |
| Total | 792 | 520 |
These two stats — Risk Profile (Initial) and Risk Profile (Revised / Current) — provide a quick overview of how many failure causes have been assigned to each risk priority level.
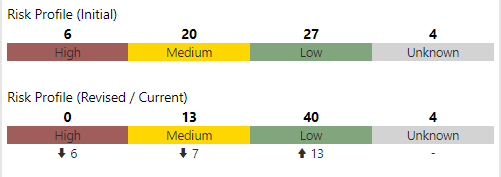
Causes are assigned to risk levels according to the "Highlight Priority Based On” setting in the project’s interface style. A priority of "unknown" indicates that a relevant risk ranking, rating or metric has not been defined for the cause. See Viewing FMEAs in SEP and RPNs and Related Metrics in the XFMEA/RCM++/RBI help.
To see the change between the initial and the revised / current values, enable the Show trend option.
This matrix provides an alternative to the Risk Profile stats.
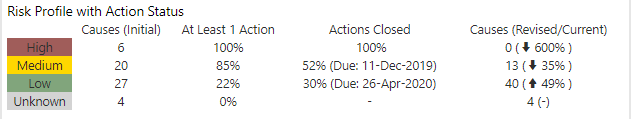
Causes (Initial) - the number of causes with an initial risk that falls within each risk priority level.
At Least 1 Action - the percentage of causes in each risk level with at least one assigned action.
Actions Closed - the percentage of actions assigned to causes in each risk level that are closed (completed and not pending approval). If this is not 100%, the tile also displays the planned completion date for the last open action.
Causes (Revised/Current) - the number of causes where the revised / current risk falls within each risk priority level, along with the percent change from the initial risk. The arrow indicates whether this change represents an increase or decrease.
This stat allows you to monitor risks and actions for a specified date range.
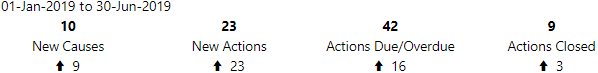
New Causes - the number of failure causes with a “created date” that falls within the period.
New Actions - the number of actions with a “created date” that falls within the period.
Actions Due/Overdue - the number of actions with a planned completion date that falls within the period (“due”) or earlier (“overdue”) and no actual completion date.
Actions Closed - the number of actions with an actual completion date that falls within the period and that are not “Pending Approval.” (See Review and Approve Actions in the help for the desktop applications.)
To select a period, use the Custom or Preset option in the date range chooser (see Selecting a Date Range).
If you are using the Preset option to specify a date range, you can choose to show the change since the last period by enabling the Show trend option in the Settings dialog box.
Note: The “last period” for the trend covers the same interval as the one you specify in the date range chooser. For example, if you specify a date range of “last 2 months” (such as May–June), the tile will show the change in risks and actions since the prior 2 month period (in this case, March–April). The Show trend option does not apply when you select “custom” dates such as 1-Oct-2018 to 31-Dec 31-2018.
© 1992-2019. HBM Prenscia Inc. ALL RIGHTS RESERVED.
| E-mail Link |