
This tile allows you to view a prioritized list of potential failure causes, along with the controls and actions that will mitigate the risks associated with these causes.
By default, the Failure Causes Grid tile displays data for all FMEAs in the active project. You can change the project and/or select one or more FMEAs via the Settings dialog box. (See Choose FMEAs to Display.)
This tile provides options for displaying ratings and/or metrics that have been enabled for the project.
To specify which fields to display, click the Columns button in the Settings dialog box to open the Column Chooser. If you choose to display the Cause, Actions or Project columns, the tile will include links that provide access to the following pages in SEP:
Cause - opens the full FMEA, with that cause highlighted. Clicking the link in the FMEA opens a page showing the details of the cause. (See FMEAs in SEP.)
Action - opens the Edit Action page. (See Actions and Messages in SEP.)
Project - opens the Project Summary page. (See Projects in SEP.)
The Column Chooser also allows you to select which ratings and/or metrics to display — for example, initial or revised RPN (RPNi, RPNr), severity (Si, Sr), occurrence (Oi, Or), detection (Di, Dr), etc. (See RPNs and Related Metrics in the XFMEA/RCM++/RBI help to learn more about ratings and metrics.)
Tip: Only the ratings / metrics that have been enabled for the project will be "selectable"; all others will be grayed out.
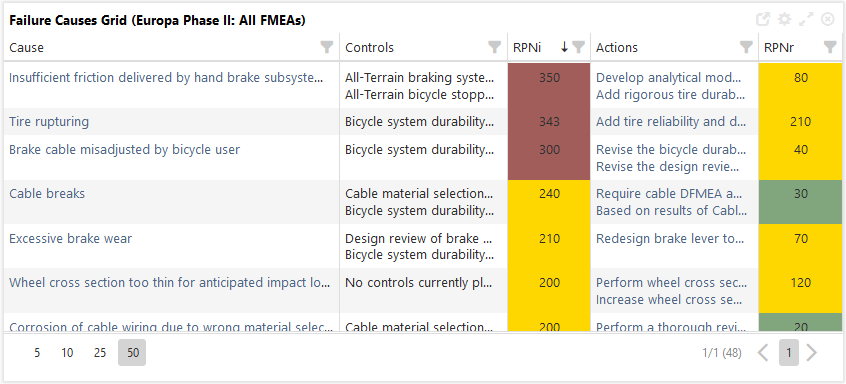
To display the priority highlight colors that have been defined for the project, enable the Show priority highlights option in the Settings dialog box. (See Viewing FMEAs in SEP to learn more about priority highlights.)
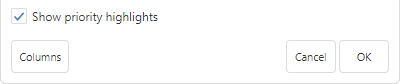
The example below shows RPNs (initial and revised) with priority highlights.
© 1992-2019. HBM Prenscia Inc. ALL RIGHTS RESERVED.
| E-mail Link |