![]()
![]()
| Related Topics: | ||
![]()
The Nevada chart format includes a statistical process control (SPC) method for analyzing warranty returns data. The method uses a chi-squared test to help you detect unusually high or low return rates for any given period, alerting you to any possible deviations in manufacturing, quality control or any other factors that may adversely affect the reliability of the product in the field. This enables you to intervene immediately and avoid increased warranty costs or more serious repercussions. The SPC application is available only for the Nevada chart format.
Note: The SPC feature applies only to homogeneous data sets and is therefore unavailable when you select the Use Subsets option on the Main page of the control panel.
The SPC method evaluates the discrepancy between the actual number of failures and the number of failures predicted by the distribution parameters. To use SPC, click the SPC page icon on the control panel.
![]()
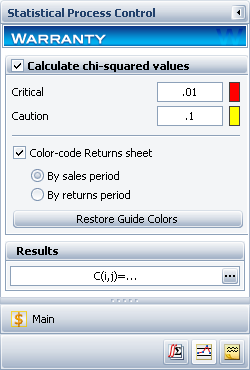
Select the Calculate chi-squared values check box. The fields for the Critical and Caution control values will become available. The control values are the upper probability levels of the chi-squared distribution below which the sales or return periods will be flagged as outliers. Enter the desired critical and caution levels in decimal form. The values must be greater than zero and less than one. By default, the critical value is 1% and the caution value is 10%, as shown next.
Calculate the chi-squared values by choosing Warranty > Analysis > Calculate or by clicking the icon on the Main page of the control panel.
![]()
If you wish to view the table of chi-squared values, click the Show Results (...) button.
Tip: If you wish to perform a manual evaluation of the table of chi-squared values, you can use Weibull++’s Quick Statistical Reference (QSR) tool to look up chi-squared values for different control values and degrees of freedom. You can access the QSR by choosing Home > Tools > Quick Statistical Reference.
To provide an easy visualization of the results, select the Color-code Returns sheet check box. You can select to evaluate the results in two ways: By sales period (results are color-coded by rows) or By returns period (results are color-coded by columns).
The default color indicators are:
Green indicates that the number of product returns is within the expected range.
Yellow indicates that the number of product returns is between the caution and critical levels.
Red indicates that the number of product returns is outside the expected range.
You can opt to change the colors in the Returns sheet by selecting the desired cells or row/column header and then choosing Sheet > Format and View > Fill Color.
To reset the colors back to their default settings, choose Warranty > Tools > Restore Guide Colors or click the Restore Guide Colors button on the SPC page of the control panel.
© 1992-2015. ReliaSoft Corporation. ALL RIGHTS RESERVED.