![]()
![]()
| Related Topics: | ||
There are several additional commands that you can use when you are working with plots.
To show the coordinates of any location on the plot, press SHIFT and click in the plot. A box displaying the coordinates of the selected location will appear, as shown next.
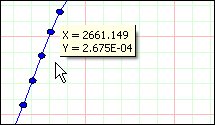
You can release the SHIFT key once the coordinates are displayed. The coordinates will continue to be displayed as long as you hold down the mouse button. You can move the pointer around in the plot and the coordinates will change to reflect its current location.
If the pointer is on a plot line (e.g., the probability line, confidence bounds, etc.), pressing SHIFT and clicking the line will track the line when you move the pointer. A crosshair will be displayed showing the current location on the line. As you move the pointer left or right, the crosshair will mirror the movement but will stay on the line and the current coordinates on the line will be displayed (i.e., Y is calculated based on X), as shown next.
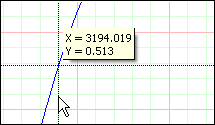
Pressing CTRL+SHIFT and clicking the line does the same thing, but X is calculated based on Y.
To add a custom label to the plot, press CTRL and click in the plot. A new label will appear in the plot, as shown next.
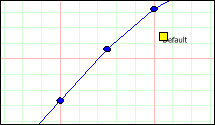
The yellow box at the upper left corner of the label indicates that the label is selected. When the label is selected, you can edit the label text directly in the plot and can also click the box and drag it to a new location, if desired. Clicking elsewhere in the plot will de-select the label. Double-click the label to open the Edit Label window, as shown next.
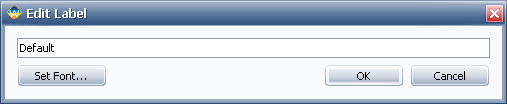
In the Edit Label window, you can specify the text for the label. Clicking Set Font opens the Font window, which allows you to specify the font, size, style, color and orientation used for the label.
Custom labels, including the coordinate labels presented next, are not available in side-by-side plots.
To add a label that displays coordinates to the plot, position the pointer at the location you want labeled then press CTRL+ALT and click the location. A coordinate label will be added to the plot, as shown next.
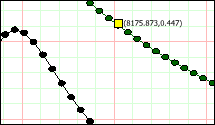
Note that a coordinates label includes a < sign pointing to the location that the coordinates refer to.
Pressing ALT and clicking a plotted line or point will open a window like the one shown next.
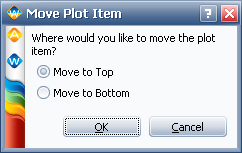
You can choose to bring the line to the front or send it to the back. If you have clicked a point, this window will enable you to bring the group of points to the front or send them to the back. This feature is useful in cases where lines or points are obscuring one another.
You can click any plot element (i.e., point, line, etc.) to open the Plot Setup window. The pointer will change from an arrow to a pointing hand when move the pointer over an element for which this is possible. Note that the element you clicked is automatically selected on the Plot Items page of the Plot Setup.
© 1992-2015. ReliaSoft Corporation. ALL RIGHTS RESERVED.