
| Related Topics: | ||
Variability analysis is available only for two level factorial and Plackett-Burman designs with standard life data, and it is used to identify the experimental run that results in the least amount of variation in the response. To perform this analysis, the design must have 2 or more runs that use the same factor level combinations for the factors that you choose to consider in the analysis.
The Variability Analysis window allows you to select the response column(s) that you want to see variability analysis for and which factors to consider. To open the window, choose Data > Design > Variability Analysis or click the icon on the Data tab control panel.
![]()
The Variability Analysis window is shown next.
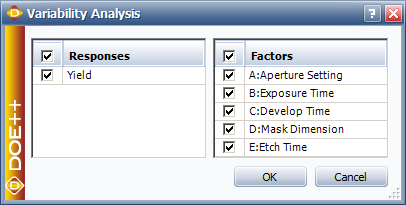
For each response that you select in this window, a standard deviation column will be inserted beside it on the Data tab, displaying the standard deviation of the observations taken for each factor setting combination across replicates. Such columns can be selected for inclusion in the analysis (i.e., used as responses).
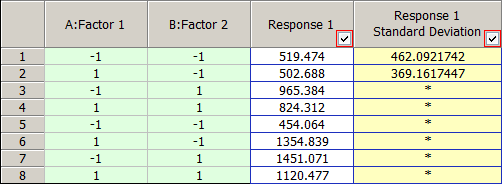
The Factors area allows you to specify which factors are considered in the variability analysis. If, for example, only Factor A is selected, there will be only two rows of data in the Response Standard Deviation column: one for the runs that used A's low level and one for the runs that used the high level. The remaining rows would include an asterisk to indicate the standard deviation was displayed in a previous row, as shown next.
If the design includes blocks, the Factors area will include a Block check box that allows you to consider them in the variability analysis.
See Variability Analysis Example.
© 1992-2015. ReliaSoft Corporation. ALL RIGHTS RESERVED.