
| Related Topics: | ||
The data set used in this example is available in the example database installed with the software (called "doe9_examples.rsr9"). To access this database file, choose File > Help, click Open Examples Folder, then browse for the file in the DOE sub-folder.
The name of the example project is "Factorial - Two Level Full Factorial Design."
In a prior example, two optimal solutions were found for the factor level combination that optimize the process of growing epitaxial layers on polished silicon wafers. The two solutions are shown next.

Although both solutions give the same predicted thickness (14.5 µm), it is important to identify which solution is better in terms of variability. To do this, you need to perform a variability analysis, where the analyzed response is the standard deviation of the thickness at each factor level combination.
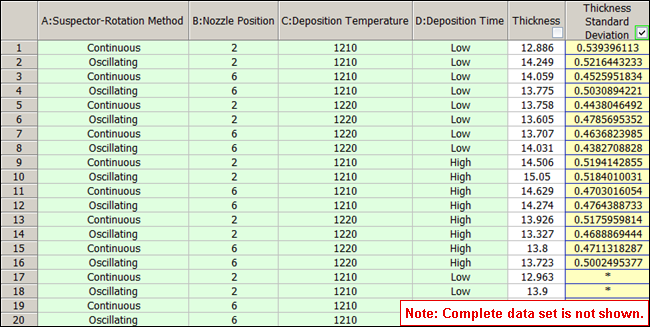
The data and results for the variability analysis are given in the "Variability Analysis" folio of the example file. On the Design tab, you can see the various settings that were used to generate the experiment design.
Each row on the Data tab shows the factor level combination and recorded thickness for a single run. In addition, the yellow Thickness Standard Deviation column, which was added using the Variability Analysis window, shows the standard deviation of the thickness at the given factor level combination. (If a cell in this column does not display a value, that's because the variation in response for that factor level combination is already shown in a previous cell.) The Thickness column was removed from the analysis by clearing the check box in the column header.
To transform the standard deviation values, choose Data > Design > Select Transformation, or click the icon on the Data tab's control panel.
![]()
Then choose the natural log transformation (which is typically used when studying variability) in the window that appears.
![]()
The results for the variability analysis are shown in the Analysis Summary area on the control panel.
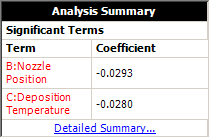
The values of the regression coefficients show that nozzle position and deposition temperature have a negative effect on the variation in thickness.
Since the significant factors have a negative effect on variability, higher values will produce lower standard deviation. Therefore, of the two optimal solutions, the second solution is better in terms of variability.
| Nozzle Position | Deposition Temperature | Deposition Time | Predicted Thickness | Predicted Thickness Std |
| Position 2 | 1210.7392 | High | 14.5 | 0.512 |
| Position 6 | 1214.8235 | High | 14.5 | 0.472 |
© 1992-2015. ReliaSoft Corporation. ALL RIGHTS RESERVED.