
| Related Topics: | ||
The following information is provided in the analysis results for Plackett-Burman designs with standard response data.
The following table provides general information about the effects of the factors and factorial interactions on the selected response. This information may be presented for individual factors and interactions or for groups of factors and interactions, depending on your analysis setting on the control panel.
The Analysis of Variance (ANOVA) table includes the following columns:
Source of Variation is the source that caused the difference in the observed output values. This can be a factor, factorial interaction, curvature, block, error, etc. If your design includes more than one factor and you have selected to use grouped terms in the analysis (specified on the Analysis Settings page of the control panel), the effects will be grouped by order (i.e., main effects, two-way interactions, etc.). Sources displayed in red are considered to be significant.
The number of Degrees of Freedom for the Model is the number of regression coefficients for the effects included in the analysis (e.g., two coefficients might be included in the regression table for a given main effect). The number of degrees of freedom for the Residual is the total number of observations minus the number of parameters being estimated.
Sum of Squares is the amount of difference in observed output values caused by this source of variation.
Mean Squares is the average amount of difference caused by this source of variation. This is equal to Sum of Squares/Degrees of Freedom.
F Ratio is the ratio of Mean Squares of this source of variation and Mean Squares of pure error. A large value in this column indicates that the difference in the output caused by this source of variation is greater than the difference caused by noise (i.e., this source affects the output).
P Value (alpha error or type I error) is the probability that an equal amount of variation in the output would be observed in the case that this source does not affect the output. This value is compared to the risk level (alpha) that you specify on the Analysis Settings page of the control panel. If the p value is less than alpha, this source of variation is considered to have a significant effect on the output. In this case, the term and its p value will be displayed in red.
The following values are shown underneath the ANOVA table, and they indicate how well the model fits the data:
S is the standard error of the noise. It represents the magnitude of the response variation that is caused by noise. Lower values indicate better fit.
R-sq is the percentage of total difference that is attributable to the factors under consideration. It is equal to Sum of Squares(factor)/Total Sum of Squares. Higher values usually indicate better fit.
R-sq(adj) is an R-sq value that is adjusted for the number of parameters in the model. Higher values indicate better fit.
The following table provides specific information on the contribution of each factor or factorial interaction to the variation in the response and an analysis of the significance of this contribution.
This table includes the following columns:
Term is the factor, factorial interaction, curvature, block, etc. under consideration. Terms displayed in red are considered to be significant. In cases where there is no error in the model, significant effects are determined according to Lenth’s method and the term names are displayed in red and followed by an asterisk (*).
Effect is a measure of how much the response value (Y) changes when the value of the corresponding term in the model changes from the low level to the high level.
Coefficient is the regression coefficient of the term, which represents the contribution of the term to the variation in the response.
Standard Error is the standard deviation of the regression coefficient.
Low Confidence and High Confidence are the lower and upper confidence bounds on the regression coefficient.
T Value is the normalized regression coefficient, which is equal to Coefficient/Standard Error.
P Value (alpha error or type I error) is the probability that an equal amount of variation in the output would be observed in the case that this term does not affect the output. This value is compared to the risk level (alpha) that you specify on the Anaysis Settings page of the control panel. If the p value is less than alpha, this source of variation is considered to have a significant effect on the output. In this case, the term and its p value will be displayed in red.
Other tables include:
This information is presented using multiple tables.
The Response table displays the response that the regression equation applies to and the units of measurement that were entered for the response (if any).
The Additional Settings table shows the transformation and risk level you entered for the response.
The Significant Terms table is applicable only when at least one term was found to be significant. It shows the significant terms in the Name column and the associated regression coefficients in the Coefficient column.
The Equation tables show the regression coefficients for the model of the selected response. For example, consider this table:
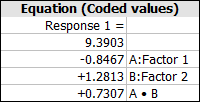
The corresponding model for this table is y = 9.3903 - 0.8467x1 + 1.2813x2 + 0.7303x1x2.
The first Equation table shows the coefficients for a model that uses coded values for the factors.
The second Equation table shows the coefficients for a model that uses the actual factor values.
All of the following tables provide information that was generated from the main calculations. The available tables will vary depending on design type you are working with. The results that could be available include:
This item is available for all designs with at least two factors. It describes the alias structure for the design, taking into account only the terms you've selected to include in the analysis. Together with your engineering knowledge, you can use this information to help determine whether any important interaction information was lost due to aliasing. When aliased terms exist, the following areas will be shown:
Terms selected to be in the model lists all the terms that are considered for inclusion in the regression model (i.e., the selections in the Select Terms window).
Terms included in the model lists all the selected terms that are included in the model. The alias structure determines which terms are excluded.
Alias Structure lists the aliased effects based on the selected terms. For example, A • B = A • B + C • D means the interaction effect A • B is aliased because it is indistinguishable from effect C • D. Therefore, the model cannot include both interaction terms; it will include only one (e.g., A • B).
This shows the variance/covariance matrix, which is available for one factor R-DOE designs and all other designs with two or more factors. The diagonal elements in this matrix are used to calculate the coefficients in the MLE or Regression Information table.
This table is available for one factor R-DOE designs and all other designs with two or more factors. It displays various analysis results for each run and highlights significant values. The following columns are included:
Run Order is the randomized order, generated by DOE++, in which it is recommended to perform the runs to avoid biased results. Note that any changes made to the Run Order column on the Data tab will be reflected here.
Standard Order is the basic order of runs, as specified in the design type, without randomization. Note that any changes made to the Standard Order column on the Data tab will be reflected here.
Actual Value (Y) is the observed response value for the run, as entered in the response column on the Data tab.
Predicted Value (YF) is the response value predicted by the model given the factor settings used in the run.
Residual (or "regular residual") is the difference between the actual value (Y) and the predicted value (YF) for the run.
Standardized Residual is the regular residual for the run divided by the constant standard deviation across all runs.
Studentized Residual is the regular residual for the run divided by an estimate of its standard deviation.
External Studentized Residual is the regular residual for the run divided by an estimate of its standard deviation, where the run in question is omitted from the estimation.
Leverage is a measure of how much the run influences the predicted values of the model, stated as a value between 0 and 1, where 1 indicates that the actual response value of the run is exactly equal to the predicted value (i.e. the predicted value is completely dependent upon the observed value).
Cook’s Distance is a measure of how much the output is predicted to change if the run is deleted from the analysis.
Values that are considered to be significant, or outliers, are displayed in red. For the residual columns, significant or critical values are those that fall outside the residual’s upper or lower bounds, calculated based on the specified alpha (risk) value.
The ReliaWiki resource portal has more information on how significant values are determined for the Leverage and Cook's Distance columns at: http://ReliaWiki.org/index.php/Multiple_Linear_Regression_Analysis.
This table shows the predicted response values for the given factor levels. It includes the following columns:
Effect is the main effect or interaction used to predict the response. The coefficients for effects not used in the prediction are set to zero.
Level is the combination of factor levels used to predict the response.
Mean is the predicted response value.
What's Changed? In DOE++ 1, diagnostic information (e.g., the residual for each run) was accessed by clicking an icon on the control panel to open the Diagnostics window. In the current version, this information is placed together with other analysis results in the Analysis Summary window.
© 1992-2015. ReliaSoft Corporation. ALL RIGHTS RESERVED.

 ANOVA Table