
| Related Topics: | ||
The design folio control panel allows you to control the settings for analyzing response data and evaluating an experiment design. It also displays the results of the analysis/evaluation. The panel is composed of the following pages:
The Main Page contains most of the tools you will need to analyze response data.
The Analysis Settings Page contains the analysis settings that are also displayed on the Main page.
The Evaluation Settings Page contains the settings that are used when you perform a design evaluation.
The Comments Page allows you to enter notes or other text that will be saved with the folio.
If your design includes a life data response, the Identifiers and Publishing pages will also be available. These pages allow you to publish the results as a model.
Tip: There is a horizontal splitter bar directly above the icons at the bottom of the panel. If you drag it as far up as it will go, all of the pages of the panel will be accessed by large buttons. If you drag it all the way down, all of the pages will be accessed by small icons. Positions in between allow you to use some large buttons and some small icons. (See Control Panels.)
The Main page of the control panel includes the following tools and areas.
The folio tools are arranged on the left side of the control panel. Use these tools to configure your analysis and experiment with the analysis results. Depending on the type of design you are working with, the control panel may contain some or all of the following tools:
![]() Calculate analyzes the data for each response that is selected to be included in the analysis. To exclude a response from the analysis, clear the check box in its column header.
Calculate analyzes the data for each response that is selected to be included in the analysis. To exclude a response from the analysis, clear the check box in its column header.
![]() Plot creates a plot based on the analysis. If you click this icon before the current data set has been analyzed, an analysis will be performed automatically.
Plot creates a plot based on the analysis. If you click this icon before the current data set has been analyzed, an analysis will be performed automatically.
![]() Select Terms opens a window that allows you to specify the terms (i.e., factors, factorial interactions, blocks and quadratic effects) to be considered for each response.
Select Terms opens a window that allows you to specify the terms (i.e., factors, factorial interactions, blocks and quadratic effects) to be considered for each response.
![]() View Analysis Summary opens a window that contains detailed information about current and past analysis results.
View Analysis Summary opens a window that contains detailed information about current and past analysis results.
![]() Optimization adds an optimal solution plot to the Optimization folio that is linked to the design folio. If no linked Optimization folio exists, the software will create one.
Optimization adds an optimal solution plot to the Optimization folio that is linked to the design folio. If no linked Optimization folio exists, the software will create one.
![]() Overlaid Contour Plot adds an overlaid contour plot to the Optimization folio that is linked to the folio. If no linked Optimization folio exists, the software will create one.
Overlaid Contour Plot adds an overlaid contour plot to the Optimization folio that is linked to the folio. If no linked Optimization folio exists, the software will create one.
![]() Select Transformation opens a window that allows you to select a transformation to apply to each response.
Select Transformation opens a window that allows you to select a transformation to apply to each response.
![]() Prediction opens a window that allows you to enter values for each factor and see predicted results for the selected response.
Prediction opens a window that allows you to enter values for each factor and see predicted results for the selected response.
![]() Visible Columns opens a window that allows you to choose which columns to hide/show in the Data tab.
Visible Columns opens a window that allows you to choose which columns to hide/show in the Data tab.
![]() Transfer Data to Weibull++ transfers data from the DOE++ design folio to a new Weibull++ standard folio. The factor level combination used for each data point will be recorded in the Comments column of the new data sheet.
Transfer Data to Weibull++ transfers data from the DOE++ design folio to a new Weibull++ standard folio. The factor level combination used for each data point will be recorded in the Comments column of the new data sheet.
![]() Transfer Data to ALTA transfers data from the DOE++ design folio to a new ALTA standard folio. The factor values used for each data point will be treated as stress values in the new data sheet.
Transfer Data to ALTA transfers data from the DOE++ design folio to a new ALTA standard folio. The factor values used for each data point will be treated as stress values in the new data sheet.
The Main page of the control panel may also contain some or all of the following settings. Information and examples on how to use these settings for particular designs are available in the documentation for the various design types.
The Response drop-down list is used to select the response that all the displayed settings and analysis results will apply to.
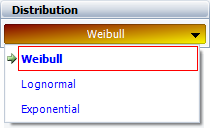
The Distribution area is used to select a life distribution for reliability DOE.
The Settings area is used to view the available analysis settings, which vary depending on the design type. The following picture shows an example of the settings that are available in a two level factorial design.
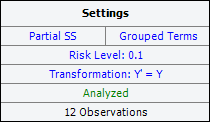
In this example:
The partial sum of squares ("Partial SS") and grouped terms are used.
The specified risk level is 10%.
No transformation is used (i.e., the "transformed" response, Y', is equal to the non-transformed response, Y).
"Analyzed" is shown in green, which indicates that the current response data has been analyzed using the current settings. Otherwise, this would show "Modified" in red.
The last row indicates that the analyzed data consists of 12 observations.
Note: If you are using a robust parameter design and the selected response is signal noise ratio, this area will also include a row to indicate which kind of signal noise ratio is being analyzed (i.e., nominal, smaller or larger).
To configure the settings used in the analysis, click the blue text. These settings are also accessible on the Analysis Settings page of the control panel. See the Design Folio Control Panel Analysis Settings Page section for a description of all available settings.
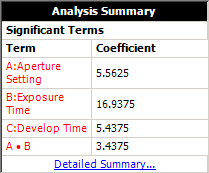
The Analysis Summary area is shown when the current response data has been analyzed using the current settings. This area displays the terms that were found to be significant, as well as their associated regression coefficients. Click the Detailed Summary link in this area to view the details of the analysis results (including an ANOVA table).
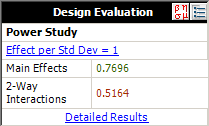
The Design Evaluation area is used to help you determine the efficiency of the current design. In the picture shown next, the main effect that is the least likely to be detected by design has a 77.11% of being detected. Click the Detailed Summary link in this area to view details of the evaluation results (including the probability of detection, or power, for individual effects and interactions).
The Analysis page of the design folio control panel includes additional settings that may be applicable for the current analysis. It may contain some or all of the following options (which can also be changed on the Main page of the control panel).
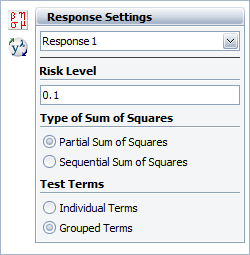
The Response Settings drop-down list is used to choose the response that all the visible settings and analysis results will apply to. When you choose a response here, it will automatically be chosen when you return to the Main page.
The Risk Level, or alpha value, is a measure of the risk that the analysis results are incorrect (i.e., alpha = 1 - confidence level).
The next area allows you to specify the Type of Sum of Squares to use in the analysis. Select the Partial Sum of Squares option to test if a term is significant given that all other terms are considered in the model. Select the Sequential Sum of Squares option to test if an additional term is significant given that the terms before it are already in the model. This area is not applicable to R-DOE.
The Test Terms area specifies what the information in the ANOVA table in the Design Folio Analysis Results applies to. If you select Individual Terms, the software will separately examine the effects of each individual factor and/or factorial interaction. If you select Grouped Terms, it will examine groups of effect types, such as main effects, two-way interactions, etc.).
You can also analyze the selected response or open the Select Transformation window by clicking the icon to the left of the Response Settings area.
© 1992-2015. ReliaSoft Corporation. ALL RIGHTS RESERVED.