
| Related Topics: | ||
Use the Report Builder to design the reports and charts that will be available in the Reports page and the Charts page. You can save your own reports/charts that are visible only to you (or shared with specific users or groups). If you have the required permissions, you can also modify the built-in "Standard" reports/charts or save new "Public" reports/charts that are visible to all XFRACAS users.
To access the Report Builder, choose Options > Designers > Report Builder.
![]()
Use the Select Report drop-down lists to specify which type of report/chart you want to create, or select one that you want to modify. For example:
To create a new report, select an existing one that is similar (e.g., "Standard Reports" and "Incident"). Apply your changes and click Save As. You will be prompted to specify the name, description and other details. (See Save Report window.)
To modify a report that already exists, select that report (e.g., "My Reports" and "Saved report name"). Apply your changes and click Save (or click Save As if you also want to be prompted to change the name, description or other details.)
If you want to preview the results based on the current settings, choose Options > Report > Generate.
![]()
For predefined report types (Standard Reports, Chart Reports, Administrator
Reports), you can click ![]() to reload the last saved
settings. If the saved settings are different from when XFRACAS was installed,
you can also click
to reload the last saved
settings. If the saved settings are different from when XFRACAS was installed,
you can also click ![]() to reset the system defaults.
to reset the system defaults.

For reports that were created by users (My Reports, My Chart Reports,
Public Reports, Public Chart Reports, Custom SQL Statements) you can click
![]() to reload the last saved settings for the report or
to reload the last saved settings for the report or ![]() to delete the report.
to delete the report.

The table contains a row for each field that you have chosen to filter by and/or display in the results.
To add a field, choose it from the Additional
Fields drop-down list and click the ![]() icon.
icon.
Note: The maximum number of optional columns that a report can include is determined by an application admin. After you have reached that limit, you can no longer add additional fields.
To remove a field, click the Remove
Field icon, ![]() , in that row.
, in that row.
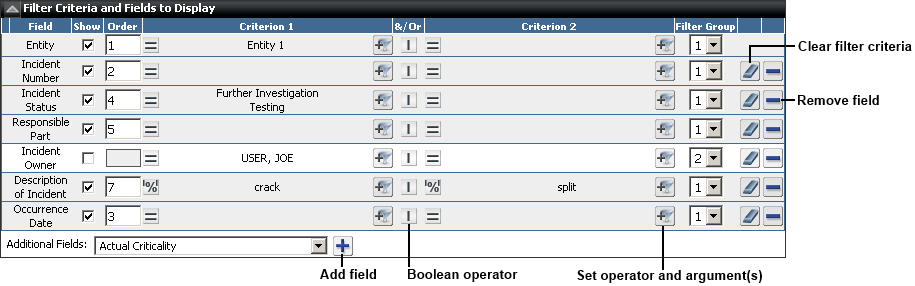
If you are building a report, use the check box in the Show column to show or hide the field in the results. If the column is shown, enter a value in the Order column to specify the location of the column in the results. Numbers that are skipped are ignored.
In each Criterion column, the icon on the left shows the operator (e.g., equals, contains, is greater than, is not empty, etc.). If the operator requires one or more arguments, these are shown in the middle of the column. If no arguments are specified, the default is "All."
To specify the operator and argument(s), click the operator
icon or the Add Filter Criteria
icon, ![]() .
.
To clear the criteria for a field, click the Clear
Values icon, ![]() , in the row.
, in the row.
If more than one criterion is specified for the same field,
click inside the &/Or
column to toggle between AND (![]() )
and OR (
)
and OR (![]() ).
).
The Filter Group column allows you to specify how various criteria interact in the search.
When applicable, report results can include information about the particular template part or serialized system that each incident or problem pertains to:
For incidents, the report can include fields from the "System/Component Information Area" as well as any configurable fields for the template part or serialized system.
For problems, the report can include the "Part Category" as well as any configurable fields for the specified part.
In the Report Builder's Additional Fields list, these fields are identified with the prefix "Part Detail" (for template parts) or "Serialized Detail" (for serialized systems).
A Print Preview field is a link to a customized presentation of the data for a particular record. New in Version 18, if an administrator has configured this type of field in the page for a given record type, you can now include those links in your report. The report results will show the same link that is displayed in the record. Since every record will have the same link, the criterion columns will not be available for this type of field.
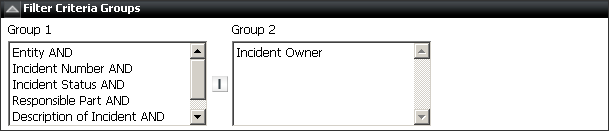
This area shows how Boolean operators will be applied for filter criteria
specified in the table. If you have specified more than one Filter
Group in the table, you can click the ![]() icon
to toggle the operator that will be applied between the groups.
icon
to toggle the operator that will be applied between the groups.
In the following example, the results will include records that match all of the criteria in the first group (AND operators for all fields in Group 1) or the single criterion in the second group (OR operator between Groups 1 and 2).
If you are building a report, you can use this area to specify how the results will be sorted when they are generated. The results will be sorted by each field in the Selected list, successively.
Select a field and click ![]() or
or
![]() to move it from one list to the other. Double-click a field in the Selected
list to toggle between ascending (ASC) and descending (DESC) order.
to move it from one list to the other. Double-click a field in the Selected
list to toggle between ascending (ASC) and descending (DESC) order.
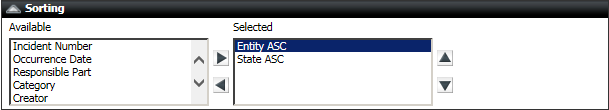
Users can also change the sort order after the report is generated. (See Reports.)
If you are building a report, this area determines whether the results will be displayed in HTML or XSLT.
HTML - the results will be displayed in a tabular format and you can specify the number of records shown per page.
XSLT - you can specify the *.xslt style sheet (Extensible Stylesheet Language Transformation) that will be used to customize the presentation of the results.
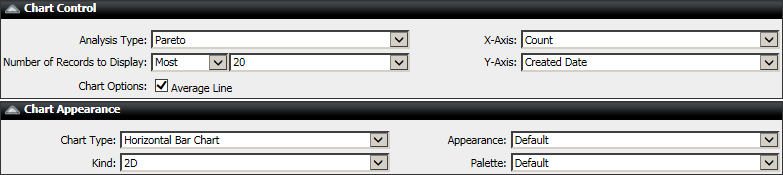
If you are building a chart, these areas allow you to specify how the data will be presented.
Analysis Type - In general, a Pareto analysis (e.g., bar charts, pie charts, scatter charts, etc.) allows you to look at quantitative factors, while a Trend Analysis (e.g. line charts) allow you to look at historical trends.
X-Axis and Y-Axis specify the information that will be shown on the axes.
Number of Records to Display
For pareto analyses, you can display the records that either have the most number of matches to the criteria or the least number of matches to the criteria.
For trend analyses, you can display the records that either have the most recent dates that match the criteria or the oldest dates that match the criteria.
Chart Options
For pareto analyses, you can show the Average Line.
For trend analyses, you can show the Average Line or the Trend Line. The Trend Line shows a smoothed-out curve that follows the data. This an Exponentially Weighted Moving Average (EWMA) line, which is calculated using a Cubic B-spline (CBS) process to smooth out the line, with a correction factor of 0.5.
The appearance settings specified here will be applied when the chart is first generated. Users can also change these options after the chart is generated. (See Charts.)
Chart Type - for Pareto analysis, select bar, line, area, step, pie or scatter. Trend charts can only display as a line chart.
Kind - 2-dimensional or 3-dimensional
Appearance - the background color scheme
Palette - the colors used for chart elements
In the following example, these settings will generate a horizontal bar chart that shows the 20 dates on which the greatest number of incidents were created along with a line showing the average number of incidents created daily.
When applicable, you can use the Save Report window to enter or change the Report Name, Report Description and Report Icon.
Depending on your permissions, you may also be able to select:
Save report for another user or Save report for a security group - makes the report available to a selected user or to all users in a selected security group. Only the specified user(s) will be able to view and edit the report, and it will show under "My Reports" or "My Charts."
Make Public - makes the report available to all users in the current entity. Any user in the entity will be able to view and edit the report, and it will show under "Public Reports" or "Public Chart Reports."
Add SDW Data Source - makes the report available to the Synthesis Data Warehouse (SDW) in Weibull++, ALTA or RGA.
You can then use the SDW to create custom dashboards for the data that will be visible in ReliaSoft desktop applications or the Synthesis Enterprise Portal (SEP). (See "Connect to XFRACAS Report" in the Weibull++/ALTA or RGA documentation.)
Within XFRACAS, these reports are not visible in the Reports page, but they can be accessed for subsequent editing under "SDW Data Sources" in the Report Builder.
© 1992-2018. HBM Prenscia Inc. ALL RIGHTS RESERVED.
 |
E-mail Link |