
| Related Topics: | ||
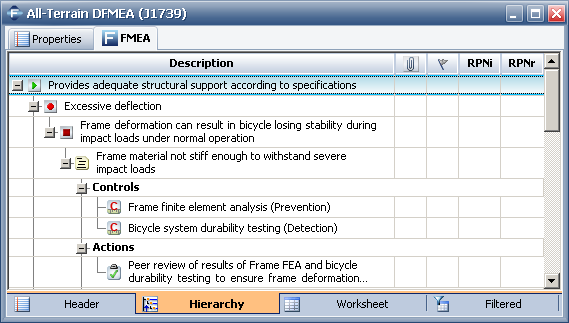
To view the FMEA in a hierarchical format, click the Hierarchy tab at the bottom of the Analysis panel.
This view, which is the default view of the FMEA analysis, displays the records defined in your analysis (e.g., functions, failures, etc.) at-a-glance in a hierarchical tree structure.
Note: The following image shows the default, Effects Before Causes, FMEA structure. The display will vary if you have selected one of the other FMEA structures.

The FMEA hierarchy view allows you to add, insert, edit, copy and paste the records in your analysis. You cannot edit text directly in this view. Instead, all editing in this view is done via properties windows that you can access by double-clicking a row in the hierarchy or by right-clicking a row and choosing Edit from the shortcut menu.
You can move the records in the FMEA hierarchy view up and down either by dragging them to the desired location or by using the Up and Down icons on the Home tab of the Ribbon.
![]()
![]()
These commands move the selected record down or up the list of records of the same type that are associated with the same record (e.g., move a failure up or down within the list of failures that have been defined for the same function).
To hide or display columns, right-click the column headers in the FMEA hierarchy view, then click Customize Columns to select which columns you want to display. These settings are stored per computer/username in the FMEA Hierarchy page of the Application Setup, so any project that you open on this computer will have the same columns displayed.
The available columns include the following:
# displays the record position number assigned by Xfmea based on the position of the record in the FMEA hierarchy. For example, if you insert a new function above an existing function, then the new function will take the number of the existing function and all functions below it will be renumbered. Likewise, if you delete a function, all functions below it will be renumbered automatically.
Description displays the description of the record.
Record ID displays the record ID, which is an identifier assigned by Xfmea. The record ID is unique among all records of that type that are defined in the database.
Attachment displays a paper clip icon if one or more files have been attached to the record.
Flag displays a flag for the record. To insert a flag, right-click inside this column and select a flag from the shortcut menu that appears. The available flags are: Complete (indicated by a green flag), In Progress (indicated by a yellow flag) and Incomplete (indicated by a red flag). This flag is displayed in the interface only and does not affect reports.
Classification displays an abbreviation of the classification that has been assigned to the cause, if any. This field is used to identify design characteristics that require special manufacturing control (e.g., Critical, Significant, Key Leading, etc.).
Observed Occurrences displays the number of occurrences, as recorded in XFRACAS, of the failure mode/cause combination for the current system hierarchy item. This column is available only when you are working with a system hierarchy item that has a current association with a part in XFRACAS. The values in this column may be drawn from XFRACAS incidents, problems or failure analyses, depending on your selection on the FMEA Hierarchy page of the Application Setup.
For example, you might have a failure mode called "Bulb failed" that has two causes, "Filament burned" and "Shattered." Assume you are basing failures on XFRACAS incidents. If there are 3 incidents in XFRACAS with the "Bulb failed - Filament burned" combination and 2 incidents with the "Bulb failed - Shattered" combination, then the Observed Occurrences column will display a value of 5 for the "Bulb failed" failure, a value of 3 for the "Filament burned" cause and a value of 2 for the "Shattered" cause.
There are also 16 columns that can be enabled to display RPN ratings and/or metrics. Each column will be displayed only if it has been selected in the Customize Columns window and is enabled in the interface style for the particular project. The lowercase letter "i" indicates an initial rating or metric while the letter "r" indicates a revised rating or metric.
S displays the severity rating assigned to the effect.
O displays the occurrence rating assigned to the cause.
D displays the detection rating assigned to the cause.
RPN displays the calculated Severity x Occurrence x Detection.
SxO displays the calculated Severity x Occurrence.
SOD displays the severity, occurrence and detection ratings in the following format: [Severity][Occurrence][Detection]. For example, if the severity is 7, the occurrence is 5 and the detection is 6, then the resulting SOD will be 756. When the issues are sorted in descending order, they will be prioritized first by severity, then by occurrence and then by detection.
SD displays the calculated Severity x Detection, which is similar to the SOD metric described above.
RR displays the risk ranking for the cause. This column will be displayed only if risk ranking is enabled and risk ranking columns are selected for use in the interface style for the project.
You also can use the Highlight Priority command to highlight the records in the FMEA hierarchy view based on the risk assessment ratings. Choose FMEA > Tools > Highlight Priority to toggle the priority highlights on and off. For more information about how to setup the priority highlights, refer to the Displaying RPN Metrics in the Analysis Panel topic.
© 1992-2015. ReliaSoft Corporation. ALL RIGHTS RESERVED.