

The non-parametric RDA folio is based on the mean cumulative function (MCF). This analysis provides a plot of the MCF to illustrate the average number of recurring failures of a system, or a group of systems, over a given period of time (or distance, cycles, etc.). The MCF can be used to evaluate whether the number of failures increases or decreases over time, to predict the future number of failures or to compare different data sets from different designs, operating conditions, production periods, etc. The ReliaWiki resource portal has more information on the MCF at: http://www.reliawiki.org/index.php/Non-Parametric_Recurrent_Event_Data_Analysis.
To create a non-parametric RDA folio, choose Home > Insert > Non-Parametric RDA, or right-click the Repairable Systems folder in the current project explorer and choose Add Non-Parametric RDA on the shortcut menu.
![]()
The following picture shows an example of the non-parametric RDA folio data sheet.
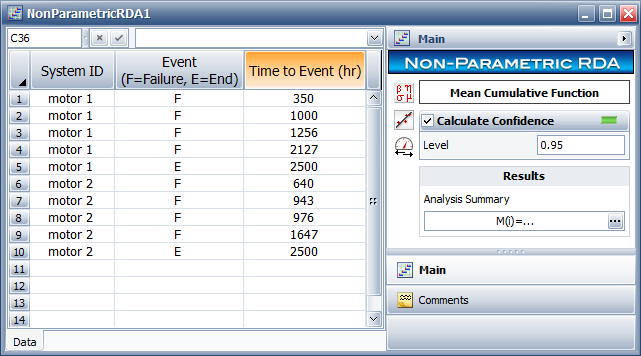
The System ID column identifies the system that experienced an event. In the sample data sheet, two units of the same type of motor are being tracked. The resulting mean cumulative function (MCF) will depict the average behavior of the motors.
The Event column describes the type of event. An F indicates a failure and an E indicates that the observation period for the unit has ended. Each unique system in the data sheet must have a single end event. If you do not enter an end event for a system, then the end event is assumed to be equal to the last failure time for that system.
The Time to Event column indicates the age of the system when the event occurred. For each unique system, the time of the end event (E) must be equal to or greater than the last failure time of that system. The time of the end event is also known as the censoring age, because the product’s failure or repair history beyond that time is unknown.
The Calculate Confidence option on the control panel calculates the upper 1-sided and lower 1-sided confidence bounds of the MCF at a specified confidence level. Specify the desired confidence level in the Level input field. Selecting this option also automatically includes the confidence bounds in the plot of the analysis.
To analyze the data set, choose Recurrent Event Data > Analysis > Calculate or click the icon on the control panel.
![]()
Note that this will also sort the data set by system ID and then by time to event.
To view the results, click the Show Results (...) button to open the Results window, as shown next.
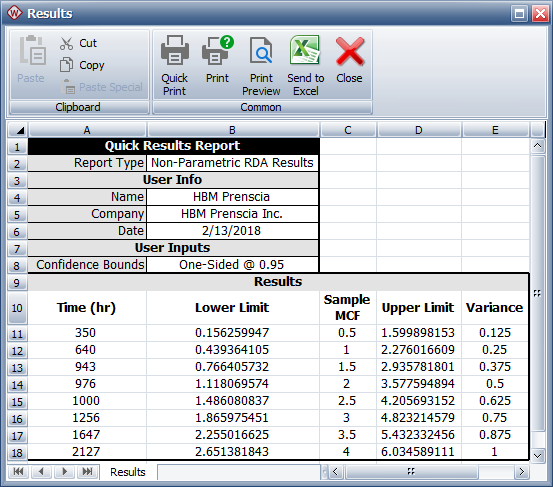
The Time column displays the system ages, sorted in chronological order, that were entered for the failure events. The Sample MCF column shows the average number of failures at each particular age.
The Variance column indicates the amount of uncertainty in the MCF value. This is also used to obtain the 1-sided confidence bounds that are displayed in the Lower Limit and Upper Limit columns. These three columns are available only if you have selected the Calculate Confidence check box in the control panel and specified a confidence level.
The MCF values and the confidence bounds can also be displayed in an MCF plot in order to visualize the behavior of the recurring failures. To view the MCF plot, choose Recurrent Event Data > Analysis > Plot, or click the icon on the control panel.
![]()
The following plots show some examples of the different MCF shapes.

Constant Recurrence Rate indicates that the units are exhibiting what is usually referred to as useful life, which is a stable period during which the failures occur at a rate that is neither increasing or decreasing with time.
Increasing Recurrence Rate is a curve that is concave up and the recurrence rate of the failures increases (the data points are becoming horizontally closer) as the population ages. This is typical of units with wearout problems. It could also indicate that the system maintenance is degrading with time.
Decreasing Recurrence Rate is a curve that is concave down and the recurrence rate of the failures decreases (the data points are becoming horizontally farther apart) as the population ages. This is typical of units exhibiting a period of infant mortality problems. It could also indicate that the system maintenance is improving with time.
Bathtub Recurrence Rate is a curve that starts as concave down, and then becomes concave up. This behavior is typical of units that first experience infant mortality problems and then exhibit a useful life period. As the age increases, the units start to enter the wearout stage.
© 1992-2019. HBM Prenscia Inc. ALL RIGHTS RESERVED.
| E-mail Link |