
|
|
||

In ALTA, there are two types of life-stress data: times-to-failure data and free-form data. In addition, times-to-failure data may contain three forms of censoring: suspensions, interval censored or left censored data.
In an ALTA life-stress data folio, the data type you select determines the data entry columns that appear in the data sheet. The following sections describe each data type and demonstrate how to enter data in an ALTA life-stress data folio data sheet.
Tip: You can change the data entry columns for an existing ALTA data sheet anytime by choosing Life-Stress Data > Format and View > Alter Data Type.
Times-to-failure data sets, also known as complete data, are obtained by recording the exact times when the units failed. For example, if we tested 6 units at two stress levels and they all failed, and we recorded the time when each failure occurred, we would then have complete information as to the time of each failure in the sample.
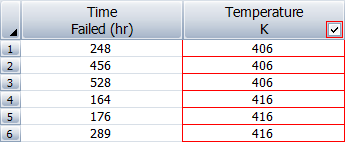
To use this data type, select the Times-to-failure data check box on the setup window. Your data sheet will have a Time Failed column for recording the times-to-failure. The example shown next displays a life-stress data folio data sheet where all the units in the sample failed. The exact time of each failure is recorded.
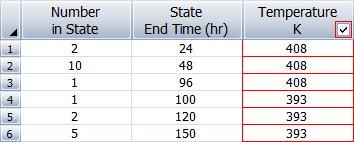
If multiple units failed at the same time, you can choose to enter the data in groups. To do this, select the I want to enter data in groups check box in the setup window. This adds a third column to the data sheet, as shown next. In this example, the units that failed at the same time are grouped together. The Number in State column indicates the number of failed units in that group (the software will automatically enter a 1 if you leave this cell blank) and the State End Time column indicates the exact time the units in each group failed.
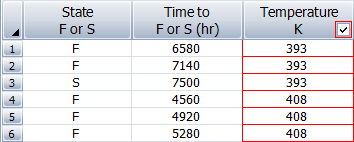
The My data set contains suspensions option allows you to record data for units that did not fail during the observation period. These data points are known as suspensions. The suspension time is the last time the unit was observed as not failed. In the example shown next, a test was conducted and five units in the sample failed, but one unit (marked with an "S" in the first column) was still operational when the test terminated at 7,500 hours.
The My data set contains interval and/or left censored data option allows you to record data when there is uncertainty as to the exact time when a unit fails. This type of data frequently comes from situations where the units are not constantly monitored. For example, if you are running a test on five units and inspecting them every 100 hours, you only know that a unit failed or did not fail between inspections. (If you select to enter both suspensions and interval data, you can enter suspensions as intervals.) Left censored data is a special case of interval censored data. With left censored data, the interval is between time = 0 and some inspection time.
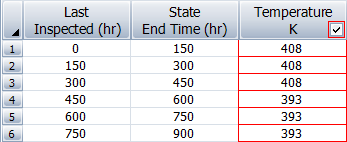
In the example shown next, the first unit was operational at the start of the test but found failed at 150 hours (thus, it is a left censored data point). The second unit was still operating at 150 hours, but it failed at some point prior to the next observation at 300 hours, and so on.
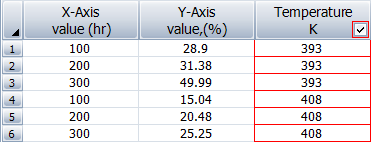
New in Version 2019, the free-form data type is used to analyze the relationship between an independent variable (x-axis data) and the percentage of failures (y-axis data) in response to the variable. The y-axis data are treated as probability units, or probits, and they show how the percentage of failures increase in response to a variable (e.g., time, distance, stress level, etc.). For example, you could use the free-form data type to record the Y percentage of items that failed after X number of hours at a given stress.
To use this data type, select the Free-form (probit) data check box in the setup window. In the data sheet, enter the values for the independent variable in the X-Axis value column and enter the cumulative percentage of failures in the Y-Axis value column. The following is an example of a data set that shows the effect of time (x-axis data) on the probability of failure (y-axis data) at specified stress levels of a product.
© 1992-2019. HBM Prenscia Inc. ALL RIGHTS RESERVED.
| E-mail Link |