![]()
![]()
After you build a Taguchi OA design, the Data tab will include a test "plan" with Response columns for entering response data. The first ten rows of an example plan are displayed next.
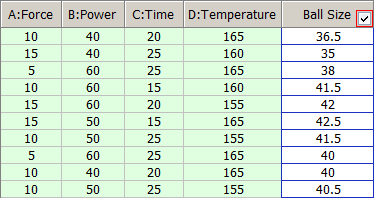
Each row represents a test run. The green columns display the factor level combinations to be used in each run, and the last column records the response values measured for each run.
All of the available columns for Taguch OA designs are described in more detail below. To hide/show columns, use the Visible Columns window.
Standard Order displays the basic order of runs, as specified in the design type, without randomization. This pattern is provided as a reference (e.g., textbook examples often use the standard order).
Tip: If you need to use a non-randomized order in an actual experiment, you can sort the design by clicking a cell in the column you wish to sort by and choosing Sheet > Sheet Actions > Sort > [Order]. For example, if changing levels in a randomized experiment would be too expensive, you can sort the design table by factor levels.
Run Order displays the randomized order generated by the software. By conducting experiments using a randomized order, you can reduce the effect of factors not being investigated.
Point Type indicates what kind of point the run is. 0 indicates that the run is a center point. 1 is used for all other points.
Block Value displays the block to which the run belongs. If the design is not blocked, all rows will display the same default value.
Factor Columns display the settings used for each factor in the run. By default, these columns are titled using the format "X: Factor Name," where X is the abbreviated name. If you have defined the units for the factor, that will also be displayed in the column heading. Factor columns are shown in green by default.
Factor levels can be displayed as the actual values assigned in the factor properties or as coded values. When you use coded values for two level factorial or Plackett-Burman designs, the low level will be displayed as -1 and the high level will be displayed as 1. When you use coded values for general full factorial or Taguchi OA factorial designs, the lowest level will be displayed as 1, the next level as 2, and so on. To switch between coded and actual values, choose Data > Display > [Value Type].
Ignore / Include allows you to specify whether the run will be included in the analysis. You can also enter an asterisk (*) in a response column to ignore that data point.
Comments allows you to enter notes or other text for each run. This information is not used in any calculations.
If your design includes only one observation per test run, the following columns will be available:
Response Columns allow you to enter the response(s) for each test run. A response column heading will include the response name and (if specified) units you have defined on the Design tab.
Each column contains a check box in the column heading that specifies whether the response will be included in the analysis. If a column is selected, the color of the check box border will indicate the status of that response's analysis. A green border indicates that the response has been analyzed using the current analysis settings; a red border indicates that it has not. Note that if you clear the check box, you will not be able to specify analysis settings for the response, nor will you be able to display it in plots or use it in optimization.
If your design includes multiple measurements per test run, the following columns will be available:
Repeated Measurements Columns are available if you chose to include repeated measurements under the Additional Settings on the Design tab. The measurements for each test run are used to generate an average and standard deviation value for that run, either of which can be selected as the analyzed response for the experiment.
The Y Mean and Y Standard Deviation Columns are populated by the software when the data set is analyzed. They show the mean and standard deviation of the measurements taken during each test run.
© 1992-2017. HBM Prenscia Inc. ALL RIGHTS RESERVED.
 |
E-mail Link |