![]()
![]()
The data set used in this example is available in the example database installed with the software (called "DOE11_examples.rsgz11"). To access this database file, choose File > Help, click Open Examples Folder, then browse for the file in the DOE sub-folder.
The name of the example project is "Robust Parameter Design - Method Settings."
Robust parameter design is used to find the appropriate control factor levels in the design to make the system less sensitive to variations in uncontrollable noise factors (i.e., to make the system robust).
Consider an experiment that seeks to determine a method to assemble an elastomeric connector to a nylon tube while delivering the requisite pull-off performance suitable for an automotive engineering application.*
The primary design objective is to maximize the pull-off force, while secondary considerations are to minimize assembly effort and reduce the cost of the connector and assembly.
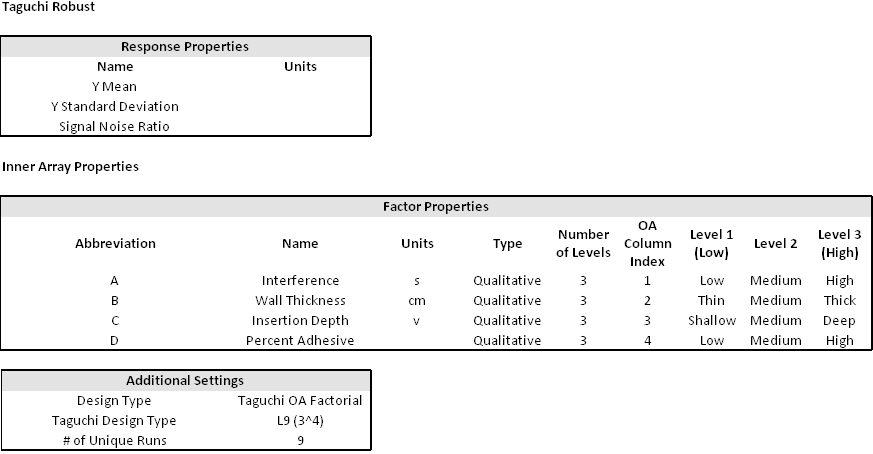
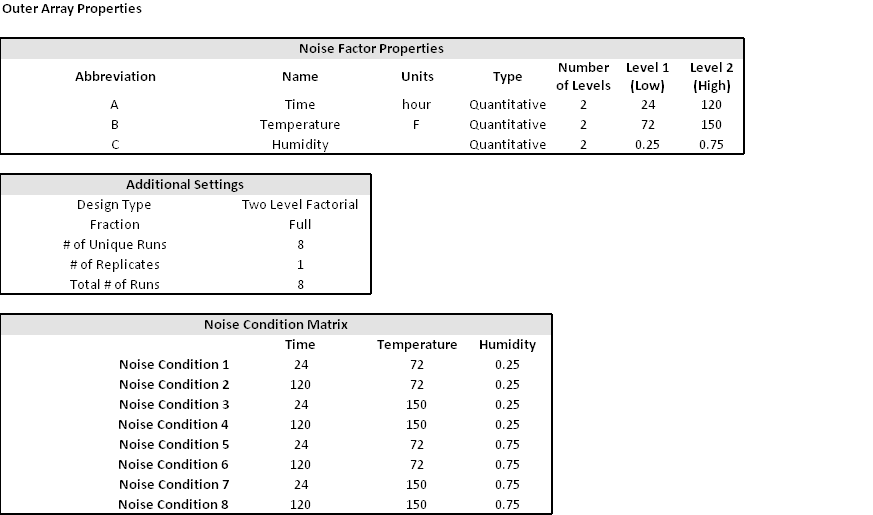
The controllable and noise factors are:
For the inner (control) array, Taguchi OA L9 (3^4) is used. For the outer (noise) array, a two level full factorial design is applied.
The measured response is the pull-off force.
The experimenters create a robust parameter design folio, perform the experiment according to the design, and then enter the response values into the folio for further analysis. The design matrix and the response data are given in the "Method Settings" folio. The following steps describe how to create this folio on your own.
Choose Insert > Designs > Robust Design to add a robust parameter design folio to the current project.
![]()
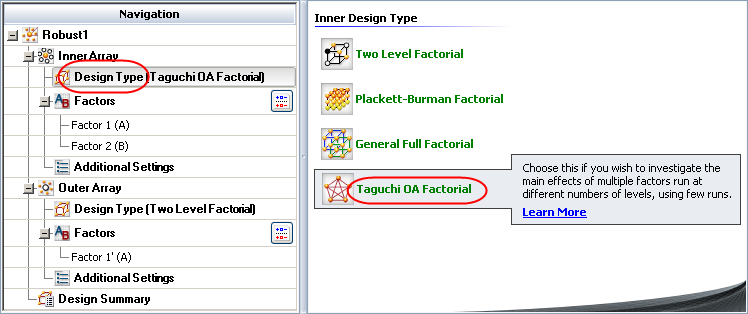
Click Design Type under the Inner Array heading in the navigation panel, and then select Taguchi OA Factorial in the input panel.
Rename the folio by clicking the Robust1 heading in the navigation panel and entering Method Settings for the Name in the input panel.
Specify the number of factors by clicking Factors under the Inner Array heading in the navigation panel and choosing 4 from the Number of Factors drop-down list.
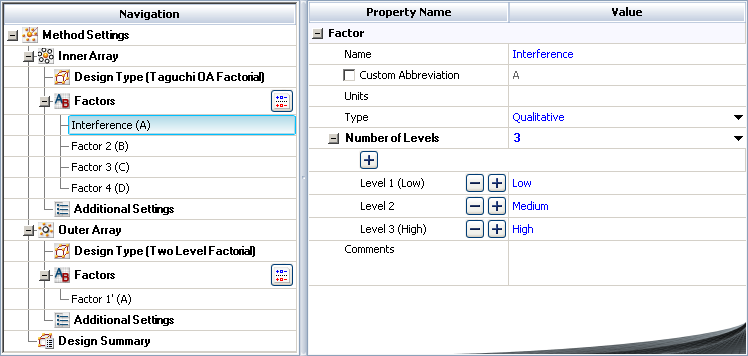
Define each factor by clicking it in the navigation panel and editing its properties in the input panel. The properties are given in the first table above. The first factor is defined as shown next.
Click Design Type under the Outer Array heading in the navigation panel, and then select Two Level Factorial in the input panel.
Specify the number of factors by clicking Factors under the Outer Array heading in the navigation panel and choosing 3 from the Number of Factors drop-down list.
Define each factor by clicking it in the navigation panel and editing its properties in the input panel. The properties are given in the second table above.
Click the Design Summary heading to make sure that you have entered all settings correctly and to view the Noise Condition Matrix. The complete Design Summary is shown next.
Finally, click the Build icon on the control panel to create a Data tab that allows you to view the test plan and enter response data.
![]()
The data set for this example is given in the "Method Settings" folio of the example project. After you enter the data from the folio, you can perform the analysis by doing the following:
Note: To minimize the effect of unknown nuisance factors, the run order is randomly generated when you create the design. Therefore, if you followed these steps to create your own folio, the order of runs on the Data tab may be different from that of the folio in the example file. This can lead to different results. To ensure that you get the very same results described next, show the Standard Order column in your folio, then click a cell in that column and choose Sheet > Sheet Actions > Sort > Sort Ascending. This will make the order of runs in your folio the same as that of the example file. Then copy the response data from the example file and paste it into the Data tab of your folio.
On the Analysis Settings page of the control panel, select to use Individual Terms for the Y Mean response, which is currently chosen in the Response drop-down list.
Choose the Y Std response from the Response drop-down list and select to use Individual Terms for it.
Choose the Signal Noise Ratio response and select Larger in the Signal Noise Ratio area, as you are aiming to maximize the pull-off force response. Select to use Individual Terms for this response as well.
Click the Calculate icon.
![]()
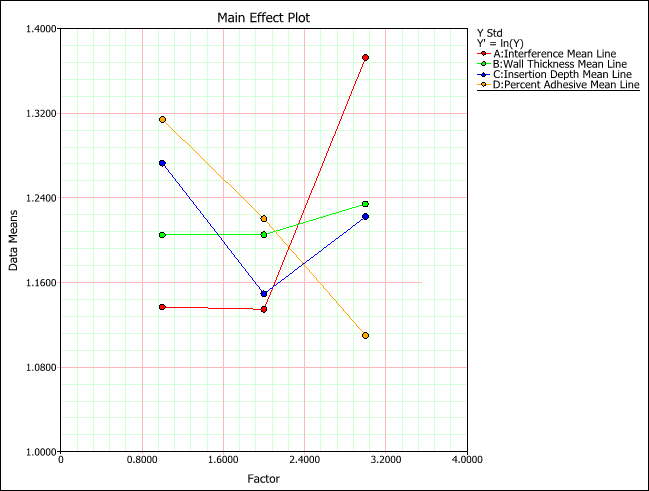
The three responses—Y Mean, Y Standard Deviation and Signal Noise Ratio—are automatically calculated and are used as the responses in the analysis. Note that the logarithmic transformation is automatically applied to the Y Standard Deviation response. To view the transformation, you can click the Transformation icon.
![]()
In the Select Transformation window, choose the Y Standard Deviation response from the Response drop-down list to see the transformation that has been applied. When you are finished viewing the transformation, click OK to close the window.
In robust design, you can use the effect plots to find proper factor settings to meet both mean and standard deviation requirements for the response.
Click the Plot icon.
![]()
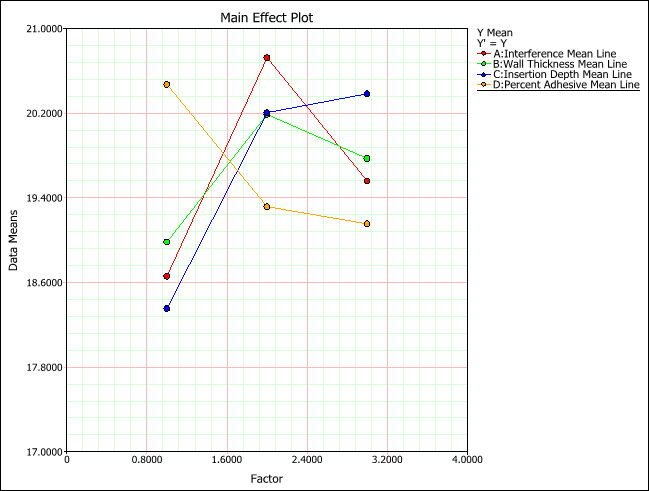
Choose Main Effects from the Plot Type drop-down list.
Choose Data Means from the drop-down list in the Response Values area. This allows you to view the response values based on values in the original data rather than fitted values. The main effect plot for the Y Mean (pull-off force) response is shown next.
To view the main effect plot for the Y Standard Deviation response, choose Y Std in the Response drop-down list.
To view the main effect plot for the Signal Noise Ratio response, choose Signal Noise Ratio in the Response drop-down list.
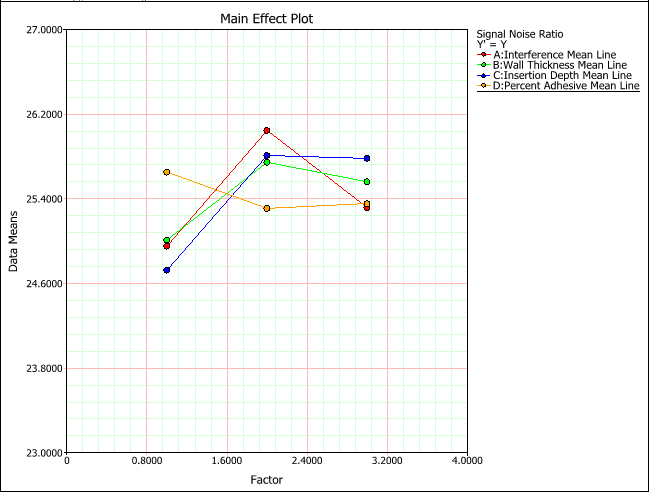
Since the goal is to maximize both signal-to-noise ratio and the pull-off force, some trade-off may need to be made in the selecting of factor settings. Examining the main effect plots for Y Mean and Signal Noise Ratio shows that the medium level for A is clearly the best choice for maximizing signal-to-noise ratio (robustness) and the average pull-off force (Y Mean). It also has a relatively low standard deviation value. For the wall thickness, B, the medium and high level are slightly better than the low level for signal-to-noise ratio; however, the medium is preferred to high level in order to maximize the average pull-off force. From the main effect plot, the better settings for factors C and D can also be determined. In the final analysis, the best settings to maximize signal-to-noise ratio are A (medium), B (medium), C (deep) and D (low), based on the experimental results for maximizing pull-off force.
* G. Taguchi, "The Taguchi Approach to Parameter Design," Quality Progress, Dec. 1987, pp. 19-26.
© 1992-2017. HBM Prenscia Inc. ALL RIGHTS RESERVED.
 |
E-mail Link |