![]()
![]()
The linearity and bias folio control panel allows you to control the settings for analyzing the measurements obtained from the gage under investigation. It also displays the results of the analysis. This topic focuses on the Main page and Analysis page of the linearity and bias folio control panel, which contains most of the tools you will need to perform the analysis. For more information about the control panel in general, see Control Panels.
The Settings area on the control panel is used to view the settings and status of the analysis. To configure the settings used in the analysis, click the blue text. The risk level setting is accessible on the Analysis Settings page of the control panel.
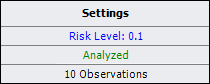
In this example:
The specified risk level is 10%.
"Analyzed" is shown in green, which indicates that the current response data has been analyzed using the current settings. Otherwise, this would show "Modified" in red.
The last row indicates that the analyzed data consists of 10 observations.
The Analysis Summary area is shown when the current measurement data has been analyzed using the current settings. This area can display the following values:
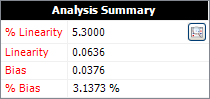
% Linearity is the percentage of increase of the process variation due to gage linearity. For example, a % Linearity of 5.3 means that the observed variation in measurements will be 5.3% greater than the variation of the parts themselves (i.e., the "true" process variation).
Linearity represents the variation of the measurements due to the gage linearity. To calculate this value, you must specify the process standard deviation on the Analysis Settings page of the control panel.
Bias is the difference between the "true" value of a measured part and the observed average. A positive bias means the gage overestimates. A negative bias means the gage underestimates.
% Bias is the ratio of the bias to the process variation. To calculate this value, you must specify the process standard deviation on the Analysis Settings page of the control panel.
Click the View Analysis Summary icon in this area to view the details of the analysis results.
The folio tools are arranged on the left side of the control panel. Use these tools to configure your analysis and experiment with the analysis results.
![]() Calculate
analyzes the measurements and displays a summary of the results on
the control panel.
Calculate
analyzes the measurements and displays a summary of the results on
the control panel.
![]() Plot
creates a plot based on the analysis. If you click this icon before the
current data set has been analyzed, an analysis will be performed automatically.
(See Linearity and Bias
Folio Plots.)
Plot
creates a plot based on the analysis. If you click this icon before the
current data set has been analyzed, an analysis will be performed automatically.
(See Linearity and Bias
Folio Plots.)
![]() View Analysis
Summary opens a window
that contains detailed information about current and past analysis
results.
View Analysis
Summary opens a window
that contains detailed information about current and past analysis
results.
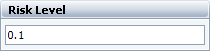
The Analysis page of the linearity and bias folio control panel includes the risk level and process standard deviation (if any) that will be used for the analysis.
The Risk Level, or alpha value, is a measure of the risk that the analysis results are incorrect (i.e., alpha = 1 - confidence level).
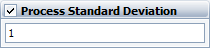
The Process Standard Deviation area allows you to specify the standard deviation of the manufacturing production process (i.e., the standard deviation of the parts). When the check box is selected, the software will multiply the value by 6 to obtain the process variation (e.g., if the diameter in centimeters is being measured and the standard deviation is 1, then the process variation is 6 centimeters). When this value is provided, the analysis results will include Linearity and % Bias values.
© 1992-2017. HBM Prenscia Inc. ALL RIGHTS RESERVED.
 |
E-mail Link |