![]()
![]()
In addition to significant enhancements in the Version 10 Synthesis Platform, we also continue to expand the capabilities of individual Synthesis desktop applications.
Here’s a quick overview of the main new and improved features in Weibull++ and ALTA.
For Weibull++ standard folios, you can now use fractional failure analysis to account for the effectiveness of an assumed corrective action or product redesign in your analyses. For example, if the fix for a failure is expected to be 70% effective, you can enter the failure count as 0.3 (30%) in the data sheet. This allows you to analyze a product's reliability, B10 life or other metrics assuming an implemented fix.
![]() The degradation analysis folio allows
you to extrapolate failure times based on the measured degradation in
a relevant characteristic over time (e.g., wear, crack propagation, level
of performance, etc.). In addition to the Linear, Exponential, Power,
Logarithmic, Gompertz and Lloyd-Lipow models, you can now create your
own user-defined degradation models.
The degradation analysis folio allows
you to extrapolate failure times based on the measured degradation in
a relevant characteristic over time (e.g., wear, crack propagation, level
of performance, etc.). In addition to the Linear, Exponential, Power,
Logarithmic, Gompertz and Lloyd-Lipow models, you can now create your
own user-defined degradation models.
We’ve also added a new destructive degradation folio for situations in which some or all of the units under test are measured only once. This is particularly useful when you want to analyze degradation data obtained from tests that must destroy the unit in order to obtain the measurement.
When you use the cumulative damage model in ALTA PRO, you can use stress profiles to describe testing conditions where the stress varies with time (e.g., step-stress, ramp-stress, etc.). Now in Version 10, the new Stress Profile Plot shows both the profile and the failures that occurred in each segment.
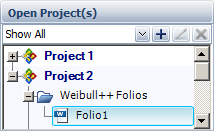 In all Synthesis desktop applications
that use a current project explorer (Weibull++/ALTA, RGA, DOE++, BlockSim/RENO
and Lambda Predict), you can now choose to have multiple
projects open simultaneously. When this feature is enabled, it’s easier
than ever to import/export between projects using convenient drag and
drop.
In all Synthesis desktop applications
that use a current project explorer (Weibull++/ALTA, RGA, DOE++, BlockSim/RENO
and Lambda Predict), you can now choose to have multiple
projects open simultaneously. When this feature is enabled, it’s easier
than ever to import/export between projects using convenient drag and
drop.
![]() The Synthesis
Workbook is a custom reporting tool that is built directly in to many
Synthesis desktop applications (replacing Analysis Workbooks and Word
Report Templates from prior versions). The new tool provides an updated
interface, better integration between spreadsheet/word processing and
an unlimited number of associated data sources.
The Synthesis
Workbook is a custom reporting tool that is built directly in to many
Synthesis desktop applications (replacing Analysis Workbooks and Word
Report Templates from prior versions). The new tool provides an updated
interface, better integration between spreadsheet/word processing and
an unlimited number of associated data sources.
In addition, if your organization chooses to implement a web-based portal for an enterprise database, you can now share selected reports to be accessible from any web-enabled device!
![]() The Synthesis
Data Warehouse (formerly called "Reliability Data Warehouse")
enables you to extract data from the XFRACAS incident tracking system
for the purpose of either life data analysis or reliability growth analysis.
Now in Version 10, we have added the ability to set up custom connections
to extract reliability-related data from other external data sources (including
Access, Oracle and SQL Server).
The Synthesis
Data Warehouse (formerly called "Reliability Data Warehouse")
enables you to extract data from the XFRACAS incident tracking system
for the purpose of either life data analysis or reliability growth analysis.
Now in Version 10, we have added the ability to set up custom connections
to extract reliability-related data from other external data sources (including
Access, Oracle and SQL Server).
![]() If your organization chooses to implement the web-based
Synthesis Enterprise Portal
for an enterprise database, you can choose to publish selected analysis
information to share with the team – including managers and colleagues
who don’t have Synthesis desktop applications installed – accessible via
any web-enabled device.
If your organization chooses to implement the web-based
Synthesis Enterprise Portal
for an enterprise database, you can choose to publish selected analysis
information to share with the team – including managers and colleagues
who don’t have Synthesis desktop applications installed – accessible via
any web-enabled device.
In Weibull++ and ALTA, you can publish the following summary for any calculated data sheet in a standard or specialized folio:
The folio and data sheet identifiers.
The "quick results summary" report (which is also accessible from the folio control panel).
The plot that’s currently displayed in the associated plot sheet.
![]() A diagram skin
provides a quick and easy way to set (or reset) all of the configurable
appearance settings for a particular diagram. In Version 10, diagram skins
are now universal across all Synthesis applications. This means that a
single skin can contain the appearance settings for all types of diagrams
in BlockSim/RENO, Weibull++/ALTA and Xfmea/RCM++/RBI.
A diagram skin
provides a quick and easy way to set (or reset) all of the configurable
appearance settings for a particular diagram. In Version 10, diagram skins
are now universal across all Synthesis applications. This means that a
single skin can contain the appearance settings for all types of diagrams
in BlockSim/RENO, Weibull++/ALTA and Xfmea/RCM++/RBI.
![]() We have completely upgraded the 3D
plotting utility, with significant appearance improvements (including
anti-aliasing and more legible text) and many more configuration options.
We have completely upgraded the 3D
plotting utility, with significant appearance improvements (including
anti-aliasing and more legible text) and many more configuration options.
In addition, you can now save individual 3D plots with the project, and also create 3D overlay plots.
In Version 10, you can now examine sections of a plot up close with the new zoom function for plots. Simply point the mouse pointer over the area in the plot you want to zoom in or out of, and then rotate the mouse wheel. Press ESC to return to the original scale.
© 1992-2016. ReliaSoft Corporation. ALL RIGHTS RESERVED.
 |
E-mail Link |