
The times-to-failure data types are used for analyzing failure times recorded from in-house reliability growth testing. Different data sheets are available depending on how the testing was conducted and what information is available:
If you will be analyzing failure times from a single system (or the combined times from multiple systems), there is a choice of two data sheets depending on whether you will enter exact failure times or grouped (interval) data:
If you will be analyzing failure times from multiple identical systems (where the data from each system is identified by the specific System ID), there is a choice of four data sheets depending on how the operating times of the systems are determined. (See Times-to-Failure Data from Multiple Systems for more information about these data sheets.)
Multiple Systems - Known Operating Times
Multiple Systems - Concurrent Operating Times
Multiple Systems with Dates
Multiple Systems with Event Codes
If you will assume that all fixes are applied immediately after failure and before testing resumes (traditional reliability growth analysis), then you can use the Crow-AMSAA (NHPP) or Duane models. If you want to account for different fix strategies used for different failure modes (growth projections analysis), choose the Crow Extended model.
When you select the Crow Extended model, the Classification and Mode columns will be inserted into the data sheet. You can also manually insert or remove these columns by choosing Growth Data > Format & View > [Insert Columns/Delete Columns] > Projections. The Crow Extended model and mode classifications are discussed in Failure Mode Classifications.
By default, all data sheets include a Comments column for logging any pertinent information about each row of data. You can add a second comments column or delete the columns by choosing Growth Data > Format & View > [Insert Columns/Delete Columns] > Comments. The information in these columns does not affect the calculations in the folio.
See also Minimum Data Requirements for Times-to-Failure Data.
The Failure Times data type is used for situations where the exact failure times have been recorded. This data type can be used to analyze the data from a single system or for the combined times from multiple systems. For example, if three identical systems are tested and one fails at 10 hours, the recorded failure time is 30 hours.
The failure times are recorded in the Time to Event column in the data sheet. The times can be cumulative (where each row shows the total amount of test time when the failure occurred) or non-cumulative (where each row shows the incremental test time from when the last failure occurred). (See Cumulative vs. Non-Cumulative Data.)
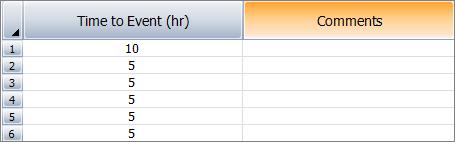
The following example shows a data set in which the times are cumulative. The first failure (row 1) occurred at 10 hours. The second failure (row 2) occurred 5 hours later at 15 hours of total test time. The rest of the data can be read in a similar manner.

Failure Times Data Sheet for Traditional Reliability Growth Analysis (Cumulative)
The next example shows the same data set, but where the times are non-cumulative.
Failure Times Data Sheet for Traditional Reliability Growth Analysis (Non-Cumulative)
When you use the Crow-AMSAA (NHPP) or Duane model, the assumption is that fixes are applied when failures are found; therefore, each row in the data sheet will represent a different design configuration. Alternatively, when you use the Crow Extended model, you assume that different fix strategies are used for different failure modes (i.e., A = no fix, BC = fixed during test or BD = delayed fix). You will be required to identify and classify the failure mode responsible for each failure, as well as specify the effectiveness factor for each delayed fix (see Failure Mode Classifications).
Tip: If your data set failed the goodness-of-fit test, you can smooth out the analysis by organizing the data into groups and transferring them into a Grouped Failure Times data sheet. To do this, choose Growth Data > Options > Group Data. For more information on how to use the tool, see Group Data.
The Grouped Failure Times data type is used for cases where the failures occurred within specified time intervals, but the exact times are not known (i.e., interval data). This data type can be used to analyze the data from a single system or for the combined times from multiple systems (e.g., if three identical systems are tested and one fails between 10 and 20 hours, the recorded interval is 30 to 60 hours).
This data sheet can also be used for situations when the exact failure times are available, but it is useful to group the data into intervals for analysis purposes. For example, you could use this data sheet to smooth out the analysis of a Failure Times data set that failed the goodness-of-fit test. (See Group Data.)
The Interval End Time column is for recording the times that an interval ended. The times are cumulative (where each row shows the total amount of test time accumulated by the end of each interval). The Failures in Interval column is for recording the number of failures that occurred in each interval. The failure numbers are non-cumulative (where each row shows the number of failures that occurred in that interval only). (See Cumulative vs. Non-Cumulative Data.)
When you use the Crow-AMSAA (NHPP) or Duane model, the assumption is that fixes are applied at the end of each interval; therefore, each row in the data sheet will represent a different design configuration. The following example shows a data set where five identical systems are inspected every week. The systems accumulate a total of 250 hours of test time each week. In the first week (row 1), the total number of system failures that occurred in that week is 3. In the second week (row 2), the total number of system failures that occurred in that week is 8. The rest of the data sheet can be read in a similar manner.
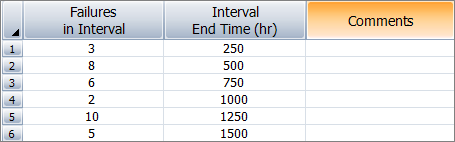
Grouped Failure Times Data Sheet for Traditional Reliability Growth Analysis
When you use the Crow Extended model, you assume that different fix strategies are used for different failure modes (i.e., A = no fix, BC = fixed during test or BD = delayed fix). You will be required to identify and classify the failure mode responsible for each failure, as well as specify the effectiveness factor for each delayed fix, if any (see Failure Mode Classifications).
For example, the following data set shows that in the first week (rows 1 to 2), the total number of system failures that occurred in that week is 3. Two of these failures are identified as BC100 (row 1) and one failure is identified as BD1 (row 2). In the second week (rows 3 to 8), the total number of system failures that occurred in that week is 8, and the failures are identified as BD1, BC150, BC4, BC60 (with 3 occurrences), BD23, BC3 and A75.
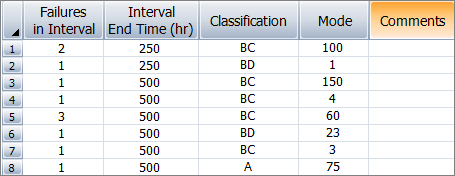
Grouped Failure Times Data Sheet with the Crow Extended Model.
© 1992-2019. HBM Prenscia Inc. ALL RIGHTS RESERVED.
| E-mail Link |