
When you are analyzing data from multiple systems, RGA combines the data into a single representative system that allows you to evaluate all the failures that occurred during the observation period. You can view the resulting timeline via the System Operation plot, which also shows the failure times of each available system in the data sheet.
In the Systems Operation plot, you can select to display or hide a system on the plot by choosing Plot > Options > Plot Systems or by right-clicking the plot and choosing the option on the shortcut menu.
![]()
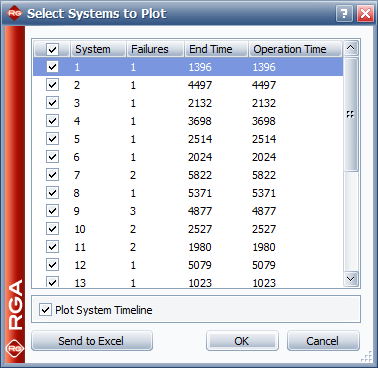
The Select System to Plot window shows all the systems that were analyzed, including the end time, total operating time and number of recorded failures in each system. To add or remove a system on the plot, select or clear the corresponding check box. Click the column heading above the check boxes to select or clear all check boxes.
To change the order in which the systems appear in the plot, click any of the column headings to sort the values. For example, clicking the Failures column heading will sort the systems from the lowest to the highest number of failures. Clicking the heading again reverses the sort order. Clicking one more time returns the order to its original state (i.e., sorted by system).
To show or hide the timeline of the representative system, select or clear the Plot System Timeline check box.
To export all the data shown in the window to an Excel file, click the Send to Excel button.
© 1992-2017. HBM Prenscia Inc. ALL RIGHTS RESERVED.
 |
E-mail Link |