
When you are analyzing data from multiple systems, RGA combines the data into a single representative system that allows you to evaluate all the failures that occurred during the observation period.
In the following times-to-failure data types, the data sets are combined to form an equivalent system:
Multiple Systems - Concurrent Operating Times
Multiple Systems with Dates
Multiple Systems with Event Codes
In the Repairable Systems data type, the failure times are placed on a single timeline to form a superposition system.
In the Fleet data type, the failure times are stacked into a cumulative timeline.
For more information about how the software combines the data for analysis, click one of the links above. This topic focuses on the two different ways that you can view and enter data for all of these data types, regardless of how the analysis is performed.
The Normal View displays the data for multiple systems all together in the same data sheet, while the Advanced Systems View displays the data one system at a time and provides a navigation panel to select which system you wish to view. Any changes that you make to the data while in one view will be reflected if you switch to the other view; however, only the Advanced System View allows you to select specific systems to be excluded from the analysis (e.g., you may choose to exclude a specific system if that data set is not representative of the entire population).
To switch between the two views, choose Growth Data > Format & View > Switch Systems View or click the icon on the Main page of the control panel.
![]()
Regardless of which view you choose, the System Operation plot shows the failure times of the systems that were included in the analysis, as well as the timeline for the representative system.
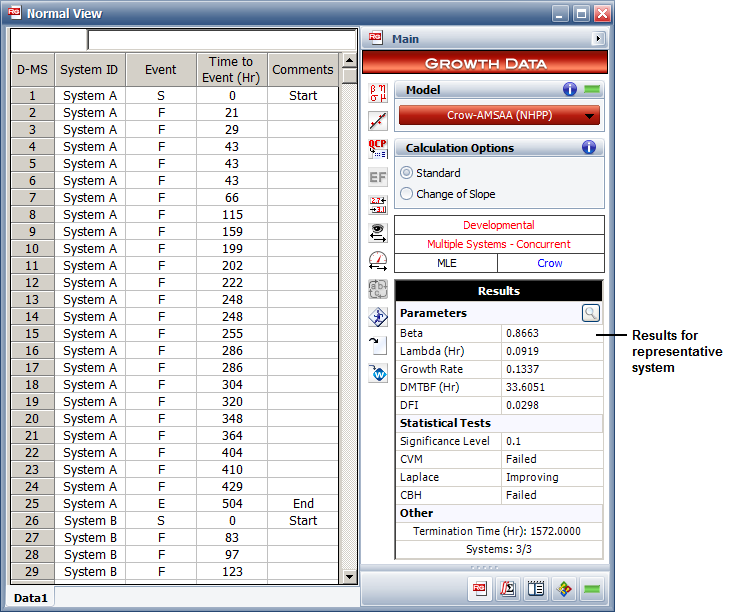
In the Normal View, the System ID column is for recording the identifier of the system (e.g., System A, SN#1234, etc.). All events entered for this system must have the same ID. The Event column specifies whether the row represents the start time (S), failure time (F) or end time (E) of the system. The Time to Event column is for recording the time of the event.
When you calculate the data sheet, the analysis results of the representative system (i.e., the equivalent system, superposition system or cumulative timeline) are displayed in the Results area of the control panel, as shown next. If you wish to see the results for an individual system, you must switch to the Advanced Systems View.
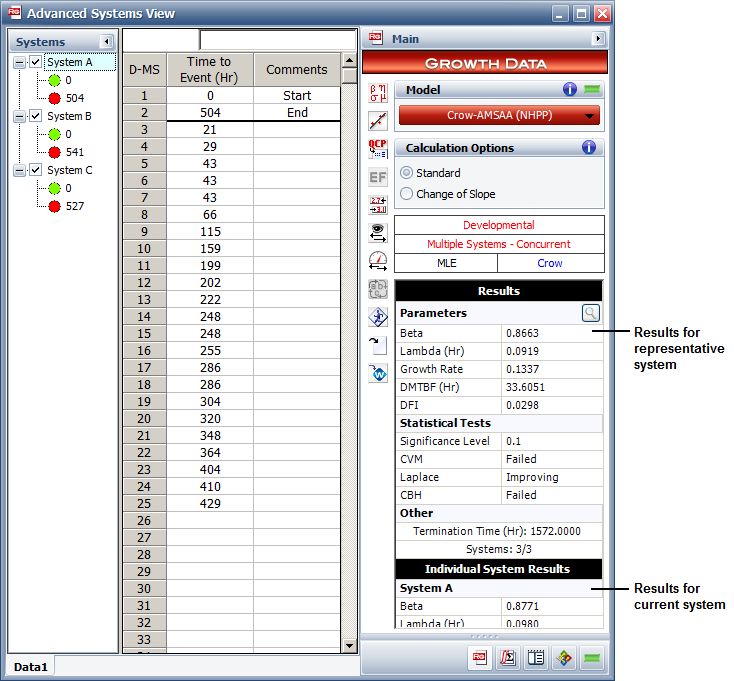
In the Advanced Systems View, the left side of the data sheet shows all the systems that have been defined along with their start times (marked with green bullets) and end times (marked with red bullets). The check box to the left of each system name allows you to select whether to include that system in the representative system for analysis (i.e., the equivalent system, superposition system or cumulative timeline). By default, all systems are selected to be included in the analysis; however, you can clear the check box to remove the system from the combined analysis. You can also edit a system name by right-clicking it and choosing Rename on the shortcut menu.
The following example shows the Advanced Systems View with the data for System A visible. In the Time to Event column, the start time of the system is entered in row 1, while the end time is entered in row 2 (these rows are reserved for this information). The failure times are entered into the subsequent rows, starting with row 3.
When you calculate the data sheet, the analysis results for the representative system (i.e., the equivalent system, superposition system or cumulative timeline) are shown in the Results area of the control panel. In addition, the analysis results for the individual system that is currently selected will be displayed in an Individual System Results,as shown next.
© 1992-2017. HBM Prenscia Inc. ALL RIGHTS RESERVED.
 |
E-mail Link |