
In Lambda Predict, there are two ways to create plot sheets:
To create an ad hoc plot for a single standard item (i.e., ![]() ,
,
![]() ,
, ![]() ,
, ![]() ,
,
![]() ,
,
![]() or
or ![]() )
or block (i.e.,
)
or block (i.e., ![]() or
or ![]() ), choose
Prediction Tools > Data Views
> Plot Viewer.
), choose
Prediction Tools > Data Views
> Plot Viewer.
![]()
You can then opt to save the plot with the project by clicking the Save icon on the control panel. The plot will be saved under the Stored Plots heading in the current project explorer. Any changes you later make to the stored plot will be saved automatically.
To create a plot that includes data from more than one prediction standard or block, choose Home > Insert > Plot. This type of plot is automatically saved with the project.
Note that if you delete a prediction that is referenced by a stored plot, the plot will remain available but you will not be able to make any changes to it.
The following sections describe the plots that can be created in Lambda Predict. For general information on working with plots, see ReliaSoft Plot Utilities.
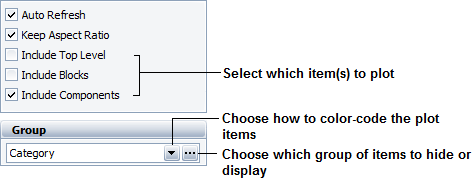
To plot data, select at least one of the following options in the control panel: Include Top Level, Include Blocks and/or Include Components. If selecting to include blocks or components, verify whether the plotted system/assembly contains those sub-items; otherwise, the software will have insufficient data to create a plot.
By default, each item on the plot is shown in a different color. When applicable, you can choose to color-code items based on their Category, LCN, Part Number or Reference Designator. For example, if you select to color-code by category, all capacitors will be shown in the same color, all resistors will be shown in a different color, and so on.
In addition to the group colors, you can choose which group of items to hide or display on the plot. For example, if grouping by category, you can choose to hide all capacitors from the plot.
For MIL-217 and Bellcore/Telcordia predictions, the available plots are:
The Failure Rate plot compares the failure rate of all sub-items in the selected standard item or block.
The MTBF plot compares the MTBF of all sub-items in the selected standard item or block.
The Unreliability plot compares the unreliability value of all sub-items in the selected standard item or block.
The Mission Phase plot allows you to compare a metric of interest across two or more mission phases. For example, if you choose to plot the failure rate for three mission phases, the plot will compare the failure rates of all sub-items in the system in each mission phase. You can define up to ten mission phases to plot. (See Mission Phase Plots.)
In addition, you can plot any of the metrics above (except mission phase) against any of the following stress factors:
Temperature
Temperature Delta
Environment
Current, Power or Voltage Stress
When plotting a metric against a stress factor, you will need to enter/select the value of the stress factor in the plot sheet's control panel. For instance, when plotting against environment, click the Environment button on the control panel to specify which environments will be included or excluded in the plot.
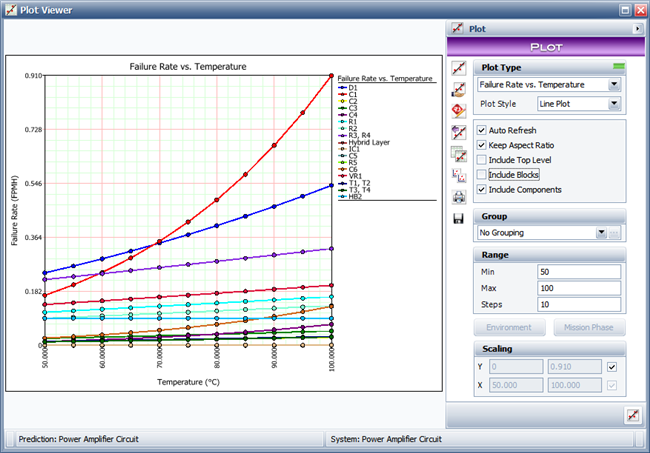
To plot against temperature, you will need to specify a minimum and maximum range for the temperature, as well as the number of points (or steps) to display on the plot. For example, the following picture shows a failure rate vs. temperature plot where the temperature range is from 50 to 100 ºC and the number of steps is set to 10.
For NSWC predictions, the available plots are:
The Failure Rate plot compares the failure rate of all sub-items in the selected standard item or block.
The MTBF plot compares the MTBF of all sub-items in the selected standard item or block.
The Unreliability plot compares the unreliability value of all sub-items in the selected standard item or block.
In addition, you can plot any of these metrics against temperature or temperature (Delta). Similar to what was described above for MIL-217/Bellcore and Telcordia plots, you will need to specify a minimum and maximum range for the temperature, as well as the number of points (or steps) to display on the graph.
For FIDES predictions, the available plots are:
The Failure Rate plot compares the failure rate of all sub-items in the selected standard item or block.
The Failure Rate Contribution plot compares the contribution made by all sub-items to the failure rate of the selected standard item or block.
The MTBF plot compares the MTBF of all sub-items in the selected standard item or block.
The Factor Contribution by Component block compares the contribution made by each sub-item to the acceleration factors (e.g., thermal cycling factor, mechanical factor, chemical factor, etc.).
The Factors plot compares the failure rate of each sub-item based on the acceleration factors (e.g., thermal cycling factor, mechanical factor, chemical factor, etc.).
The Failure Rate by Phase plot compares the failure rate of the standard item or block in all phases in the life profile.
The Factor Contribution by Phase plot compares the contribution made by each phase to the acceleration factors (e.g., thermal cycling factor, mechanical factor, chemical factor, etc.)
The Lambda Phase by Component plot compares the contribution made by each phase to the component's failure rate. This plot is unavailable when the system contains no components with phase-dependent failure rates.
The Unreliability plot compares the unreliability value of all sub-items in the selected standard item or block.
For Siemens predictions, the available plots are:
The Failure Rate plot compares the failure rate of all sub-items in the selected standard item or block.
The MTBF plot compares the MTBF of all sub-items in the selected standard item or block.
The Unreliability plot compares the unreliability value of all sub-items in the selected standard item or block.
In addition, you can plot any of these metrics against temperature or temperature (Delta). Similar to what was described above for MIL-217/Bellcore and Telcordia plots, you will need to specify a minimum and maximum range for the temperature, as well as the number of points (or steps) to display on the graph.
© 1992-2019. HBM Prenscia Inc. ALL RIGHTS RESERVED.
| E-mail Link |