
The Mission Phase plot is available for MIL-217 and Bellcore/Telcordia predictions. It allows you to compare a metric of interest across two or more mission phases. For example, if you choose to plot the failure rate for three mission phases, the plot will compare the failure rates of all items in the system in each mission phase. You can define up to ten mission phases to plot.
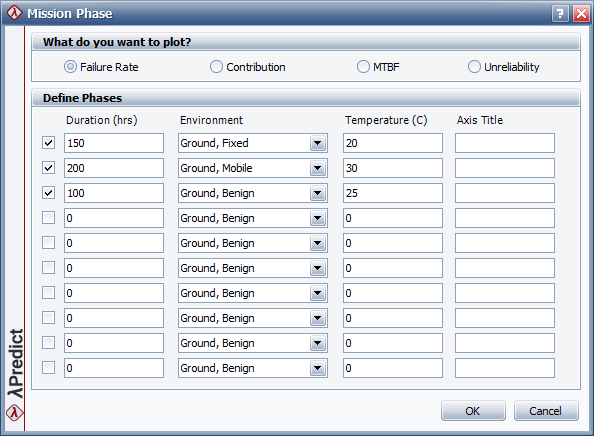
The first time you create the plot, the Mission Phase window will be displayed automatically. Select a metric of interest (i.e., failure rate, contribution, MTBF or unreliability), and then define the conditions of each mission phase. For each phase, enter the mission duration in hours, choose an environment and enter the temperature in degrees Celsius. If desired, you can also specify the title that will be displayed on the x-axis of the plot for each phase. If you do not specify titles, the default titles (i.e., "Phase 1," "Phase 2," etc.) will be used.
Once you have created the plot, you can return to the Mission Phase window and edit the conditions of the mission phases at any time by clicking the Mission Phase button on the plot sheet control panel.
The following example shows that the failure rate of a system will be compared across three mission phases. The resulting plot will show the failure rate of all sub-items in each mission phase.
© 1992-2019. HBM Prenscia Inc. ALL RIGHTS RESERVED.
| E-mail Link |